2023 VOL. 10, No. 2
Abstract: Low-powered mobile devices such as Raspberry Pis and tablets can be used as micro-servers to implement offline Learning Management Systems (LMS). Despite their potential, especially for low-income countries, such as Tanzania, no research is available detailing the affordances of these devices for supporting LMS features. This study investigated the suitability of various low-cost micro-servers for deploying LMSs. It compared the performance of the Raspberry Pi, Android tablet, and Chromebook in terms of LMS benchmarking, response time, and resource utilisation. Results showed all devices had sufficient hardware resources to support the LMS, however, software stacks, I/O performance, and platform optimisations affected the micro-servers' performance. The Chromebook had the best performance in terms of response time, followed by the Raspberry Pi and tablets. In terms of cost, the Raspberry PI was the cheapest option. The installation process for tablets was more cumbersome than the other devices, meaning the devices with better tooling and a more conventional software stack were a better option for deploying offline micro-servers.
Keywords: micro server, Learning Management Systems, offline Learning Management Systems.
The last two decades have seen growing adoption and use of various Learning Management Systems (LMS) such as Moodle and Blackboard to enhance the quality of teaching and learning in low- and middle-income countries (LMICs). LMSs, for example, enable learners to access materials electronically to supplement face-to-face teaching (Unwin et al., 2010). More broadly, educators can use these systems to deliver courses through flipped, online, or blended modes to provide greater access to learning in remote areas (Hennessy et al., 2022).
According to the Ambient Insight report, LMS adoption was expected to grow at a rate of 15% each year between 2011 and 2016 and at a rate of 0.9% between 2016 and 2021 (Adkins, 2013). Continued improvement of ICT infrastructure and proliferation of mobile phones in LMICs implies that many educational institutions will likely shift towards technology-enhanced teaching and learning, such as using LMSs. Moreover, the Covid-19 pandemic has increased the demand for governments to provide accessible technology-enhanced teaching and learning across various geographical areas (McBurnie et al., 2020). Consequently, the adoption and use of LMSs have continued to increase as many institutions and schools have been shifting to a technology-enhanced delivery mode. In Tanzania, nearly 50% of the 60 higher learning institutions have installed an LMS, with Moodle being the most popular one (Mtebe & Raisamo, 2014). Even in primary/secondary education, a number of LMSs have been implemented (Mtebe et al., 2016; Mwakisole et al., 2018).
Despite the continued adoption and use of LMSs in LMICs, the limited technological infrastructure, especially the speed and cost of the internet, remains one of the major challenges (Mukuni, 2019). An LMS requires digital devices, internet access, and the electrical power to be used effectively. These infrastructures are not evenly distributed across LMICs, with some regions having limited internet access and power (Haßler et al., 2022). For instance, of 45 reviewed articles on the implementation of LMSs in Tanzania, 60% of the articles indicated ICT infrastructure problems, especially the lack of internet connectivity, as the major barrier to implementation (Mtebe & Raphael, 2018). Similarly, Bervell & Umar, 2018 also rank ICT infrastructure as the main challenge towards implementing LMSs (Bervell & Umar, 2018).
In addition to ICT infrastructure, the cost of the internet in LMICs remains high. In 2021, the International Telecommunication Union (ITU) reported the average price of 2 GB prepaid mobile broadband, when expressed as a % of average per capita Gross National Income (GNI), was 6.5% in Africa compared to 0.5% in North America (ITU, 2021). In Tanzania, the cost of 1 GB has doubled in the past two years, due to the introduction of new government taxes on telecommunications companies (Makakala, 2021). Moreover, using typical servers to host LMSs locally in all schools is highly costly.
Given these challenges, several solutions have been proposed for implementing LMSs and other digital technologies, such as zero rating. However, while zero-rating gives free access to LMSs and other resources, there are still costs to be covered by other stakeholders, such as the government, network operators, content providers or donors (McBurnie et al., 2020). Platforms that use limited data, such as Kolibri, can be used (McBurnie et al., 2020) but Kolibri requires a micro-server, such as the Raspberry Pi or other single-board computers (Dhuny et al., 2022; Ibarra et al., 2017; Soto et al., 2019). Using Raspberry Pi as a micro-server to access an LMS has shown great potential (Dhuny et al., 2022; Ibarra et al., 2017).
However, while the Raspberry Pi (with a Linux operating system) is an obvious choice for a micro-server, there are now other types of applicable devices, such as tablets and smartphones. Such devices have similar specifications (compared to a Raspberry Pi 4B), therefore, it stands to reason they could also be used as micro-servers. As the cost of handheld devices is plummeting, a comparison of performance among various devices is important to determine the most effective low-cost micro-server in providing offline access to an LMS. Moreover, compared to a Raspberry Pi, a tablet/phone has the advantage of a user interface (screen) as well as an Uninterruptible Power Supply (battery). Another obvious advantage of the Raspberry Pi is the stability of the platform.
This study aimed to compare the performance of the Raspberry Pi, Android tablets, and Chromebook when used as micro-servers to deploy an LMS offline. Specifically, we aimed to answer the following research questions:
The findings from this study are important to those who plan to use micro-servers in implementing LMSs in areas with limited connectivity.
Three research themes are closely related to our work. First, studies that perform a comparison of Raspberry Pis when used as web servers, since they are the most researched micro-server. Second, studies that use micro-servers in school environments, and third, studies that compare the performance of different micro-servers when used as web servers.
The majority of studies have evaluated the performance of various models of Raspberry Pi or evaluated the performance of Raspberry Pi as a server for a specific application. For instance, Hajji and Tso (2016) compared the CPU utilisation, server throughput and network throughput of a single Raspberry Pi 2B and a cluster of 12 nodes for big data applications (Hajji & Tso, 2016). The study compared the performance of the Raspberry Pi 2B cluster when implemented traditionally and when used virtually. The results showed that the average network requests of the Raspberry Pi were 2809 req/s for 1 KB workload and 98req/s for 100 KB workload in the traditional implementation and 957.5 req/s, for 1 KB an d98req/s for 100 KB workload in the virtualised setup. The CPU utilisation was high for a lower workload (67.2%) and low for a higher workload (22.3%), due to higher software and hardware interface interruptions triggered by Docker when running smaller loads.
Gamess & Shah, (2022) studied the network capabilities of several Raspberry Pi models (Zero W, Zero 2 W, 3B, 3B+ and 4B). The performance evaluation was based on the TCP and UDP throughput, the TCP and UDP round-trip time, and the performance achieved when transferring files with SSH. The study showed IPv4 had a slightly better performance than IPv6. When using an Ethernet cable, the variations in performance among the different Raspberry Pi models were noticeable; the Zero W had the poorest performance and 4B showed the best performance.
Rahmat et al., (2019) evaluated the performance of Raspberry Pi image processing built using Open MPI. The results showed the programme worked well in the cluster scope and the image conversion process performed better in the cluster scope than on a single device. Similarly, Lima et al., (2019) conducted a performance evaluation of the Raspberry Pi Zero W, working as an IoT gateway and running MQTT using the processor temperature, the CPU usage level, and the rate of MQTT received messages under different Quality of Services (QoS) as performance metrics. The results showed the QoS level chosen affected its performance, CPU usage level, and temperature. It was also observed that the Raspberry Pi’s CPU usage did not reach the maximum, even when a considerable number of machines/terminals sent data to it. It may be likely that the internet network used in the experiment limited the number of messages sent per machine, and not the Raspberry Pi itself. Other studies have evaluated the performance of Raspberry Pi in real-time (Carvalho et al., 2019), in load balance on an Apache2 server, using Student Information System (SIS) as an application (Maduranga & Ragel, 2016), and in machine learning problems in edge computing (Komninos et al., 2019).
Ibarra et al. (2017) implemented mini LMSs for schools to enable learners to access educational resources using the Raspberry Pi offline. The study found that the server responded reasonably to 200 requests, simulating 10 different computers accessing simultaneously. Similarly, Dhuny et al. (2022) compared the performance of running a LAMP stack with Moodle on a Raspberry Pi 32 SD and SDD and 64 SD and SDD. The study measured the response time and Application Performance Index (Apdex) for a 32-bit OS and 64-bit OS and compared them against an increasing load. The response time improved from 46.9s to 35s for a medium-sized course with 100 users with the 64-bit SSD. The Apdex showed that the Raspberry Pi’s CPU was the limiting factor, preventing the web application from scaling beyond 40 users for medium-sized courses.
Soto et al. (2019) implemented an LMS on a Raspberry Pi to provide access to educational resources in rural schools. Although teachers were satisfied with the content and were able to access the educational resources easily, a performance evaluation of the Raspberry Pi was not conducted. Several other studies, such as Gadhave & Kore, (2016) and Ncube et al., (2020), have implemented an LMS on a Raspberry Pi in providing access to resources in areas without internet access, however, all of these studies ended up evaluating the user's perception without conducting a performance evaluation of the Raspberry Pi itself.
Relatively few studies have compared the Raspberry Pi with other devices, and, to the best of our knowledge, no studies have done a comparison of the Raspberry Pi with tablets. Istifanos and Tekahun, (2020) compared the performance of Raspberry Pi 3B and a typical laptop as servers using an experiment whereby served content, server software, and the number of simulated users sending requests were altered throughout the experiment. In this study, more than 1,000 HTTP requests were sent to the two servers. The study showed that, for static content, the Raspberry Pi achieved a response rate as high as 1,164 requests per second and CPU consumption that varied between ≈6% and ≈40%. However, on one occasion, the laptop exhibited a better processor utilisation serving HTTP requests for one user. For dynamic content, the Raspberry Pi had a slower response time.
Vaidya et al., (2021) compared the performance of a Raspberry Pi 4B (2GB RAM), MacBook Air with an Apple M1 chip and a MacBook Air with an Intel processor as web servers. The findings showed the Raspberry Pi 4B could serve between 400-600 requests per second; the Mac Air with Intel processor was almost the same; the Mac Air with M1 processor was in the range of 200-400 requests per second. The Mac Air Intel performed the best in terms of concurrent users, and the Mac Air M1 was the best in terms of CPU usage, as it maintained its CPU usage and did not show any significant fluctuations.
The study used an experimental approach where the performance of the micro-servers — running a Moodle-based LMS (https://tcpd.tie.go.tz) — was tested on four different devices: a Raspberry Pi, a Chromebook, a low-spec tablet, and a high-spec tablet. The dependent variables measured in the experiment were the performance of the micro-servers in terms of benchmark results, response time, and resource utilisation, while the independent variable was the load in terms of the number of requests the devices were subjected to.
Specifications of each of the devices as well as the software stack used in the experiment are given in Table 1. The LMS used in the experiment contained materials to support teachers' continuous professional development in pre-, primary and secondary schools in Tanzania. At the time of the experiment, it contained 16 courses with learning materials such as text, images, and videos, as well as discussion forums and quizzes.
To run the LMS on the different devices, a LAMP stack (web server and database server) was installed on each device the LMS configured. Specifically, we used Apache 2, PHP 7.4, Mariadb and Moodle version 3.11.
To enable offline access for the Raspberry Pi and the tablets, the built-in wireless hotspot was configured to make the LMS accessible. Although the Chromebook had a wireless adapter, it was impossible to set up a wireless hotspot to access the web server directly. This is because Crostini was hosted as a virtual box inside Chrome OS and had no interface to the hardware of the Chromebook and, therefore, could not access the wireless adapter. Therefore, an external router was used to connect the Chromebook and LMS users.
Table 1: Specifications of the Different Micro-Servers.
Device |
Specifications |
Price (USD) |
Operating System |
Raspberry Pi 4B |
Processor: Quad-core Cortex-A72 (ARM v8) 64-bit SoC @ 1.8GHz |
200 |
Raspbian |
High-spec tablet |
Processor: Octa-core (1x3.09 GHz Cortex-A77 & 3x2.42 GHz Cortex-A77 & 4x1.80 GHz Cortex-A55 |
900 |
Android + Termux |
Low-spec tablet |
Processor: Octa-core (4x2.0 GHz Kryo 260 Gold & 4x1.8 GHz Kryo 260 Silver) |
285 |
Android + Termux |
Chromebook |
Processor: Octa-core (2.4GHz Intel Core i5-1135G7) |
700 |
Chrome OS + Crostini |
The performance of micro-servers for the LMS was tested using three measurements: LMS benchmarking, load testing, and resource utilisation.
Benchmark is a performance benchmarking plugin provided by Moodle. The plugin assesses LMS performance by conducting tests using various scenarios and measures five key parameters: server speed, processor speed, hard drive speed, database speed, and page loading speed. Each test generates a score that is compared to predefined threshold values. The benchmarking plugin runs ten tests described in Table 2.
Table 2: Tests Run by the Moodle Benchmark Plugin.
Test |
Description |
Moodle time |
Measures the time taken to load configurations from the Moodle configuration file. |
Processor processing speed |
Measures the processor speed by calling a function with a loop. |
Reading file performance |
Reads a file several times and measures the average reading speed. The file is read from the Moodle temporary folder |
Writing file performance |
Writes several files to the Moodle temporary folder and measures the average writing time. |
Reading course performance |
Reads a course several times and measures the average reading speed. The course is read from the database. |
Writing course performance |
Writes to a course several times and measures the average writing speed. The course is written in the database. |
Database performance |
Creates and executes a complex SQL query and measures the time taken to execute the query (database speed). |
Login time performance for a guest account |
Measures the loading time for the login page of guest users. |
Login time performance for a fake user account |
Measures the loading time for the login page for fake users. |
The capacity of the system to handle a load of users was measured by simulating several users performing various activities in the LMS using the JMeter. JMeter simulates a specified amount of load by generating numerous HTTP requests and monitoring the responses. In this study, the response time was used to measure the performance of applications under different loads.
The resource utilisation of the micro-servers was compared by measuring the average load, CPU utilisation and RAM usage. To get the measurements for resource utilisation, we used the “top” command in Linux, which shows a dynamic and real-time view of the resources utilised by different processes on the thread level. The results of the top command were exported to a text file for analysis.
Two sets of experiments were conducted. The first experiment was to run the Moodle benchmark tool on each device. As described above, the Moodle benchmark tool provides performance metrics of the server. The second experiment was conducted by simulating three different scenarios on each device using JMeter. The first scenario simulated a single user accessing the LMS for a ramp-up period of 1 second. In the second scenario, the number of users was increased to 30 with a ramp-up period of 6 seconds. In the third scenario, the number of users was increased to 100 with a ramp-up period of 40 seconds.
For each test case, the tool was configured to simulate users interacting and viewing selected pages in the LMS. These included users viewing the front page of the LMS, viewing the login page, logging in and out of the system, viewing a course module, viewing a forum activity, filling out a forum reply and viewing course participants. Each test case was repeated three times and the average response times as well as the resource utilised were recorded.
The results are structured according to the three research questions that the study aimed to answer.
The Moodle benchmarking tool was used to determine how the LMS behaves under the different device configurations when not being utilised by any users. Table 3 shows the results.
Table 3: Benchmark Results of the Different Devices.
Test |
Time (sec) |
Acceptable Limit |
Critical Limit |
|||
Pi |
Low spec tablet |
High spec tablet |
Chromebook |
|
|
|
Moodle time |
0.020 |
0.018 |
0.011 |
0.017 |
0.5 |
0.8 |
Processor processing speed |
0.301 |
0.122 |
0.098 |
0.147 |
0.5 |
0.8 |
Reading file performance |
0.050 |
0.079 |
0.072 |
0.027 |
0.5 |
0.8 |
Writing file performance |
0.402 |
0.845 |
0.522 |
0.238 |
1 |
1.25 |
Reading course performance |
0.108 |
0.344 |
0.235 |
0.063 |
0.75 |
1 |
Writing course performance |
0.096 |
0.126 |
0.108 |
0.246 |
1 |
1.25 |
Database performance (#1) |
0.032 |
0.042 |
0.033 |
0.017 |
0.5 |
0.7 |
Database performance (#2) |
0.038 |
0.039 |
0.028 |
0.024 |
0.3 |
0.5 |
Login time performance for the guest account |
0.081 |
0.087 |
0.081 |
0.047 |
0.3 |
0.8 |
Login time performance for a fake user account |
0.057 |
0.335 |
0.166 |
0.121 |
0.3 |
0.8 |
Total time (seconds) |
1.185 |
2.037 |
1.354 |
0.947 |
|
|
Benchmark score (lower is better) |
118 |
204 |
135 |
95 |
|
|
Results show each device setup was able to pass the benchmarking test. On each device, the benchmarking test was completed below the acceptable limit. However, the test took the longest time, 2.037 seconds, on the low-spec tablet, while the Chromebook was the fastest to complete the test at 0.947 seconds. As a result, the Chromebook had the best score (95).
Further analysis of the results shows that, on each device, the writing performance step was the main bottleneck during the test. For instance, on the Raspberry Pi, the file writing step took the longest time, contributing 40% of the total time of the test. Similarly, on the Chromebook, the file writing and course writing steps were the longest, with each contributing 25% and 26% of the total time.
On the other hand, processor performance was only a limiting factor on the Raspberry Pi. On the Raspberry Pi, the processor speed step was the second slowest, consuming 25% of the total test time. This step was less significant on all other devices compared to other steps involved in the test. This was expected as the Raspberry Pi had a less powerful CPU than the other devices.
Table 3 shows the results of each device, with its response time based on the number of users simulated (1, 30 or 100).
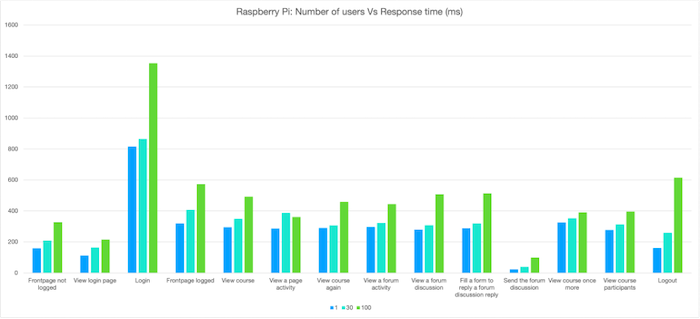
The response time in the Raspberry Pi increased as the number of users increased (see Figure 1). While there was not a big difference between 1 user and 30 users, a larger difference in the response time was seen when users were increased to 100. The login process was the slowest, taking 1,354 milliseconds, compared to other course activities, which were all below 700 milliseconds. Overall, the response time was below the recommended acceptable limit for web applications, which is 2,000 milliseconds.
Figure 1: A graph showing Raspberry Pi’s performance.
The low-spec tablet had the highest response time overall when compared to the other devices. When adding users from 30 to 100, the response time increased sharply. Except for viewing the front page and viewing the login page activities, the rest of the activities had a response time that was above 7,000 milliseconds, as seen in Figure 2. This is a significant amount of time for a user to wait for a page to respond.
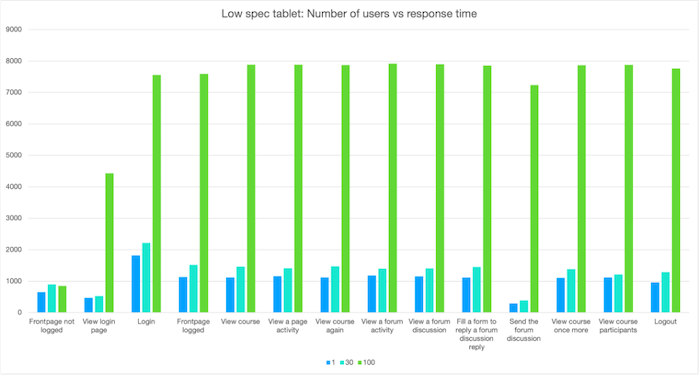
Figure 2: A graph showing the low-spec tablet’s performance.
The response time of the high-spec tablet is shown in Figure 3. The performance of the high-end tablet was not as expected as the number of users was increased. One would expect the response time to increase with an increase in users. However, in some cases, the opposite occurred, for example, with regard to the login function, as seen in the graph. The researchers had two theories to explain this: first, tablets usually have a lot of applications running in the background, such as location apps, which could have been using the resources of the tablet during testing and, second, tablets usually have two modes of running, the energy-efficient mode which is usually on and does not utilise the full capacity of the tablet or the more powerful mode, which is switched on when the tablet has a larger load. Additionally, the tablet required a lot of technical tinkering to make it possible to host the LMS, which may also have led to unpredictable performance for the tablet.

Figure 3: A graph showing the high-spec tablet’s performance.
Figure 4 shows the results of the response time of the Chromebook compared to the number of users. The Chromebook showed a steady increase in response time as the number of users increased. The activity that took the longest to respond was the login function, with an average of 1,200 milliseconds, which was a better performance compared to the other devices. However, connectivity issues were observed between the Chromebook and the router. During the tests, there were several occurrences when the Chromebook could not connect to the router until it was restarted and/or the router type was changed. This behaviour was random and could be a potential bottleneck to using the Chromebook as a micro-server.

Figure 4: A graph showing the Chromebook’s performance.
The response time of the different devices when 1, 30 and 100 users were simulated, are shown in Figures 5 through 7. The Chromebook had the best response time with all activities for one user, taking 518 milliseconds or less; for 30 users, taking 750 milliseconds or less; and for 100 users, taking less than 1,203 milliseconds. The Raspberry Pi was second-best in terms of response times, with all activities being less than 816 milliseconds with one user, 865 or less with 30 users and 1,354 milliseconds or less with 100 users.
For the tablets, the high-spec tablet performed better than the low-spec tablet as expected. For all activities tested, the high-spec tablet had a response time of 1,021 milliseconds or less for one user, 992 milliseconds for 30 users and 982 milliseconds for 100 users. The low-spec tablet had the highest response time of 1,819 milliseconds or less for one user, 2,212 milliseconds or less for 30 and an increase to 7,912 milliseconds or less for 100 users. Overall, the low-spec tablet performed the worst in terms of response time.
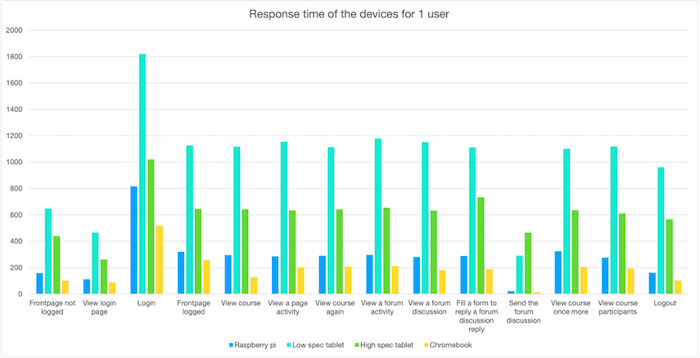
Figure 5: Response times for the four devices for one user.
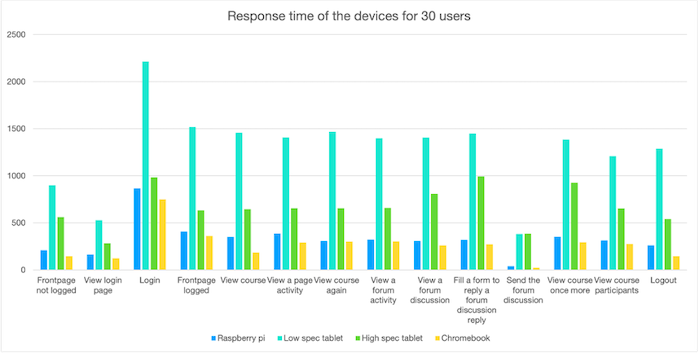
Figure 6: Response times for the four devices for 30 users.

Figure 7: Response times for the four devices for 100 users.
During the experiment, we observed how the device resources (RAM and CPU) were utilised. None of the tests reached the maximum utilisation of the device's CPU or RAM. We concluded that all devices had the technical capacity to be able to run the LMS. This is expected because all the devices tested met Moodle's recommended hardware requirements, which were 5 GB disk space, 2 GHz dual-core processor, and 1 GB RAM.
Technologies that allow users to access an LMS in areas with limited connectivity are growing. Most existing studies have adopted various models of the Raspberry Pi as a web server to provide access to an LMS. While the use of a Raspberry Pi in such contexts has shown great potential, the need to explore other types of micro-servers and compare their performance with the Raspberry Pi is important. Since servers are computers that come in different sizes, shapes, and with different operating systems (Istifanos & Tekahun, 2020), providing a comparative evaluation enables those who are using an LMS to select convenient technological solutions based on their contextual settings.
Our results show that except for the low-spec tablet, the Raspberry Pi, high-spec tablet, and Chromebook (in the configuration stated above) are viable solutions for the deployment of an offline LMS. The Chromebook had the best response time followed by the Raspberry Pi and the high-spec tablet. These findings corroborate a similar study by Istifanos and Tekahun (2020) that compared the performance of a Raspberry Pi and a laptop. The authors found that both laptop and Raspberry Pi performed well with more than 100 users but the laptop had better performance. However, the performance of the Raspberry Pi can be improved. For instance, Dhuny et al. (2022) used a 3-tiered architecture, running the Linux, Apache/Nginx, MariaDB and PHP (LAMP) stack on a 64-bit Operating System (OS) and a Solid-State Disk inside a Raspberry Pi, for performance evaluation and the relative response time improved by 11.9 s for a medium-sized course with 100 users with the upgrades.
The findings above and our findings imply that theoretically, the Raspberry Pi, high-end tablets, and Chromebooks can provide access for up to 100 users with adequate performance in terms of response time and resource utilisation. Therefore, in schools with many teachers (up to 100) the Raspberry Pi, a high-spec tablet, and a Chromebook should be adequate micro-servers for the LMS. However, limitations do need to be considered.
Practically, the Raspberry Pi has a limitation on the maximum number of devices that can be connected simultaneously to its hotspot. The Raspberry Pi used in this study (see Table 3), when configured with minimal firmware, could support up to 19 devices simultaneously (RPi-Distro, 2021). For the Chromebook, an additional router is needed to provide a hotspot. This adds to the cost and requirements for reliable power for both the Chromebook and the router. It is advisable to use a USB-powered router, powered using the Chromebook itself. The random connectivity issues between Chromebook and the router could also be a bottleneck to using the Chromebook as a micro-server.
Regarding the tablets, in practice, they are limited by the number of users who can connect via hotspot. Android tablets allow connecting only 10 devices simultaneously. However, since the testing was conducted using a simulation tool, the results indicate that when using an external router to connect more users, the tablet had good performance (less than 1,000 milliseconds response time for as many as 100 users). Therefore, a tablet could be used as a micro-server for less than 10 users and if used without a router, and up to 100 users if used with a router. Additionally, tablets require extra configurations to ensure that the server processes are not optimised, and they do not enter the sleep state.
This study compared the performance of three LMS micro-server setups (Raspberry Pi 4, Chromebook, and tablets). All micro-servers had sufficient hardware resources to support the LMS and passed the minimum performance requirements for smooth operation. All devices also had a software stack that supported all the features and functions provided by the LMS. However, the main constraint was the I/O performance of these devices. Furthermore, the actual installation process was still cumbersome. Apart from the Raspberry Pi, the other devices still had limited tools and software incompatibility issues that made this process difficult.
The results also show that the performance comparison of the micro-server between devices was influenced by hardware capability and other factors, including software stacks and platform optimisations. For instance, despite having the more powerful chip, the Android devices had mixed performance results. This was due to software issues and the level of efficiency optimisations on these Android devices.
Therefore, the main distinguishing factor that determined the suitability of the micro-server setup was the maturity and stability of the platform environment. The devices with better tooling and a more conventional software stack, i.e., the Raspberry Pi and Chromebook, were still the better option for deploying offline micro-server solutions. The Android platform was still too dynamic and not optimised for running server applications, despite the convenience and advantages.
While all three micro-servers were low-cost (less than $1,000) the cheapest option was the Raspberry Pi; it cost only $200 compared to the high-spec tablet which cost $900 and the Chromebook, which cost $700. Note that, depending on the number of teachers in a school, all the devices might require an extra router, which would also add to the cost. In a country like Tanzania, where the government owns around 25,626 schools, considering adequate performance and cost savings, the Raspberry Pi appeared to provide an optimal solution.
Future work for this study is to deploy the micro-servers in real schools and evaluate their performance in practice as well as evaluate any practical issues that may arise.
Adkins, S.S. (2013). The Africa market for self-paced eLearning products and services: 2011-2016 forecast and analysis. Ambient Insight.
Bervell, B., & Umar, I.N. (2018). Blended learning or face-to-face? Does Tutor anxiety prevent the adoption of Learning Management Systems for distance education in Ghana? Open Learning: The Journal of Open, Distance and e-Learning, 35(2), 159-177. https://doi.org/10.1080/02680513.2018.1548964
Carvalho, A., Machado, C., & Moraes, F. (2019, October). Raspberry Pi performance analysis in real-time applications with the rt-preempt patch. 2019 Latin American Robotics Symposium (LARS), 2019 Brazilian Symposium on Robotics (SBR) and 2019 Workshop on Robotics in Education (WRE). https://doi.org/10.1109/lars-sbr-wre48964.2019.00036
Dhuny, R., Peer, A.A.I., Mohamudally, N.A., & Nissanke, N. (2022). Performance evaluation of a portable single-board computer as a 3-tiered LAMP stack under 32-bit and 64-bit Operating Systems. Array, 15, 100196. https://doi.org/10.1016/j.array.2022.100196
Gadhave, V.D., & Kore, S.N. (2016, May). Portable attendance system integrated with learning management systems like Moodle. 2016 IEEE International Conference on Recent Trends in Electronics, Information & Communication Technology (RTEICT). https://doi.org/10.1109/rteict.2016.7808198
Gamess, E., & Shah, S. (2022, April 18). Network performance evaluation of several Raspberry Pi models for IPv4 and IPv6. Proceedings of the ACM Southeast Conference. https://doi.org/10.1145/3476883.3520234
Hajji, W., & Tso, F. (2016). Understanding the performance of low power Raspberry Pi cloud for big data. Electronics, 5(4), 29. https://doi.org/10.3390/electronics5020029
Haßler, B., Mtebe, J., Abdelrahman, S., Adam, T., Kondoro, A., Koomar, S., & Mashauri, O. (2022). Technology options for TCPD in Tanzania [Technical Report. EdTechHub.]. https://docs.edtechhub.org/lib/X8QRZ5EJ
Hennessy, S., D’Angelo, S., McIntyre, N., Koomar, S., Kreimeia, A., Cao, L., Brugha, M., & Zubairi, A. (2022). Technology use for teacher professional development in low- and middle-income countries: A systematic review. Computers and Education Open, 3, 100080. https://doi.org/10.1016/j.caeo.2022.100080
Ibarra, M.J., Huaraca, C., Soto, W., & Palomino, C. (2017, October). MLMS: Mini learning management system for schools without internet connection. 2017 Twelfth Latin American Conference on Learning Technologies (LACLO). https://doi.org/10.1109/laclo.2017.8120932
Istifanos, M., & Tekahun, I. (2020). Performance evaluation of Raspberry Pi 3B as a web server [Bachelor’s thesis. Blekinge Institute of Technology.] Digitala Vetenskapliga Arkivet.
ITU. (2021). The affordability of ICT services. https://www.itu.int/en/ITU-D/Statistics/Documents/publications/prices2021/ITU_A4AI_Price_Brief_2021.pdf
Komninos, A., Simou, I., Gkorgkolis, N., & Garofalakis, J. (2019). Performance of Raspberry Pi microclusters for Edge Machine Learning in Tourism. European Conference on Ambient Intelligence. https://www.semanticscholar.org/paper/Performance-of-Raspberry-Pi-microclusters-for-Edge-Komninos-Simou/b7464258deb91e358c19f4620f8a7c9f5a14699d
Lima, D.B.C., Silva Lima, R.M.B., Farias Medeiros, D., Pereira, R.I.S., Souza, C.P., & Baiocchi, O. (2019, October). A performance evaluation of Raspberry Pi zero W-based gateway running MQTT broker for IoT. 2019 IEEE 10th Annual Information Technology, Electronics and Mobile Communication Conference (IEMCON). https://doi.org/10.1109/iemcon.2019.8936206
Maduranga, M.W.P., & Ragel, R.G. (2016). Comparison of load balancing methods for Raspberry-Pi clustered embedded web servers. https://doi.org/10.1109/icsec.2016.7859875
Makakala, C. (2021). Mobile internet price hikes in Tanzania. What could go wrong? The Citizen. https://www.thecitizen.co.tz/tanzania/oped/-mobile-internet-price-hikes-in-tanzania-what-could-go-wrong--3303598
McBurnie, C., Adam, T., Kaye, T., & Haßler, B. (2020). Zero-rating educational content in low- and middle-income countries. EdTech Hub. https://doi.org/10.53832/edtechhub.0004
Mtebe, J.S., Mbwilo, B., & Kissaka, M.M. (2016). Factors influencing teachers’ use of multimedia enhanced content in secondary schools in Tanzania. The International Review of Research in Open and Distributed Learning, 17(2). https://doi.org/10.19173/irrodl.v17i2.2280
Mtebe, J.S., & Raisamo, R. (2014). Investigating perceived barriers to the use of open educational resources in higher education in Tanzania. The International Review of Research in Open and Distributed Learning, 15(2). https://doi.org/10.19173/irrodl.v15i2.1803
Mtebe, J.S., & Raphael, C. (2018). A critical review of eLearning research trends in Tanzania. Journal of Learning for Development, 5(2). https://doi.org/269
Mukuni, J. (2019). Challenges of educational digital infrastructure in Africa: A tale of hope and disillusionment. Journal of African Studies and Development, 11(5), 59-63.
Mwakisole, K., Kissaka, M., & Mtebe, J. (2018). Feasibility of cloud computing implementation for eLearning in secondary schools in Tanzania. International Journal of Education and Development Using ICT, 14(1).
Ncube, B.N., Owolawi, P.A., & Mapayi, T. (2020). Adaptive virtual learning system using Raspberry-Pi. 2020 International Conference on Artificial Intelligence, Big Data, Computing and Data Communication Systems (IcABCD), 1-5. https://doi.org/10.1109/icABCD49160.2020.9183844
Rahmat, R.F., Saputra, T., Hizriadi, A., Lini, T.Z., & Nasution, M.K.M. (2019). Performance test of parallel image processing using Open MPI on Raspberry Pi cluster board. https://doi.org/10.1109/elticom47379.2019.8943848
RPi-Distro. (2021, October 1). Firmware-nonfree/debian/config/brcm80211/cypress at Bullseye · RPI-Distro/firmware-nonfree. GitHub. https://github.com/RPi-Distro/firmware-nonfree/tree/bullseye/debian/config/brcm80211/cypress
Soto, C., Jimenez, W., Ibarra, M., Moreano, L., & Aquino, M. (2019, October). Digital educational resources to motivate environmental education in rural schools. 2019 XIV Latin American Conference on Learning Technologies (LACLO). https://doi.org/10.1109/laclo49268.2019.00052
Unwin, T., Kleessen, B., Hollow, D., Williams, J.B., Oloo, L.M., Alwala, J., Mutimucuio, I., Eduardo, F., & Muianga, X. (2010). Digital learning management systems in Africa: Myths and realities. Open Learning: The Journal of Open, Distance and e-Learning, 25(1), 5-23. https://doi.org/10.1080/02680510903482033
Vaidya, K., Patel, V., & Gangrade, M. (2021). Comparison between performance of Raspberry Pi 4B and laptop computer as a server. International Research Journal of Engineering and Technology (IRJET), 8(11), 696-701.
Authors:
Dr. Salome Maro is a lecturer at the department of Computer Science and Engineering in the College of Information and Communication Technologies at the University of Dar es Salaam. She also works with the Centre of Virtual Learning (CVL) as the coordinator for external online programs offered by the University of AMITY in India. Dr. Maro has done several consultancies with different government institutions in Tanzania, where her main area of expertise is system analysis and design as well as business process re-engineering. Her main areas of research are in software engineering and EdTech, where she investigates how to utilise different modern and affordable technologies to improve teaching and learning activities. Dr. Maro holds a PhD and an MSc in Software Engineering from the University of Gothenburg in Sweden. She has published a number of papers in international peer reviewed journals and currently supervises both MSc and PhD students in the department of Computer Science. Email: salomehonest@gmail.com
Dr. Aron Kondoro is a Lecturer in the Computer Science and Engineering (CSE) Department at the University of Dar-es-Salaam (UDSM), Tanzania. His research interests include Information and Communication Systems Security, IoT, Mobile Computing, Machine Learning, and Educational Technology (EdTech). His research and consultancy activities involve evaluating the effectiveness of information systems, developing secure ICT systems, and using mobile technologies to develop applications for educational and financial use cases. Aron has been involved in several projects, including Retooling — Designing Multimedia Enhanced Content for Secondary Schools in Tanzania; data mining of learning management schools in secondary schools (Halostudy) and many others. Email: awkondoro@gmail.com
Björn Haßler is the director of Open Development & Education (https://opendeved.net), a founding director at the EdTech Hub (https://edtechhub.org) and a visiting researcher at the Faculty of Education (University of Johannesburg). He specialises in sustainable and scalable approaches for programme implementation. His research interests include digital technology (for education and research), teacher professional development, education systems research and equity/inclusion, work-based learning, and the role of organisational learning for effective research designs and programming. He is a passionate communicator with strengths in developing and leading successful collaborations, specialising in sustainable and scalable approaches for improving people's lives. Email: bjoern@opendeved.net
Prof. Joel S. Mtebe is an Associate Professor of Computer Science at the University of Dar es Salaam in Tanzania. He has been working as a consultant for the EdTechHub, supporting the use of technology in supporting teachers' continuous professional development project for primary education in Tanzania. Joel has participated in several educational technology projects and innovations, such as data mining from online learning systems in schools (the Halostudy system), and games-based learning and digital diaries for parental engagement. Prof Mtebe has supervised several Master’s and PhD students and has examined several theses and dissertations. Email: jmtebe@gmail.com
Jamie Proctor is EdTech Hub's Country Lead for Tanzania. He is based in Dar Es Salaam and coordinates different activities for the Hub, such as research and engagement, specifically in Tanzania. He also supports the Helpdesk and Sandbox work regionally across southern Africa. Before joining the EdTech Hub, he worked in DFID leading on EdTech. His background is largely in tech — spanning the startup and the UK government digital worlds. Email: jamie@edtechhub.org
Cite this paper as: Maro, S., Kondoro, A., Haßler, B., Mtebe, J., & Proctor, J. (2023). Deployment of offline Learning Management Systems: Comparing the performance of selected micro-servers in Tanzania. Journal of Learning for Development, 10(2), 280-296.