Yusuf Zafer Can Uğurhan, Emel Güler and Aras Bozkurt
2026 VOL. 13, No. 3
Abstract: Standard e-learning satisfaction scales often do not accurately reflect the diverse needs of learners in “Giga-Universities.” To fill this important measurement gap, this study created and validated the “Learner Experience and Satisfaction Scale” for the Anadolu University Open Education system, which is applicable to any mega/giga university or open university. This work is based on a combination of the Technology Acceptance Model (TAM) and the Information System Success Model, and it followed a careful process to develop the scale. Data were collected from 573 open- and distance-learning students during the summer semester of 2024-2025 via an online survey. Exploratory and Confirmatory Factor Analyses resulted in a strong 27-item tool with nine distinct dimensions: Attitude, Usefulness, Perceived Learning, Satisfaction, Social Influence, System Quality, Service Quality, Ease of Use, and Interface. Psychometric tests showed high construct validity (CFI = 0.96; TLI = 0.95; RMSEA = 0.075) and excellent internal consistency (α = 0.983). The results indicate that in large-scale environments, learner satisfaction is not just a technical matter. It is influenced by a mix of teaching, social, and service-related factors. This validated scale gives administrators and instructional designers a useful diagnostic tool for quality assurance.
Keywords: learner experience, satisfaction, distance education, open and distance learning, higher education, open education
Over the past two decades, rapid digitalisation has transformed Learning Management Systems (LMS) from basic content delivery tools into holistic learning ecosystems that shape student behaviours and satisfaction levels (Rokhim et al., 2024; Sharma et al., 2017). In open and distance learning, evaluating these platforms is essential for measuring service quality, pedagogical effectiveness, and institutional sustainability (Thanh et al., 2024; Yang, 2024). This is particularly critical for giga-universities serving over one million active learners each (Bozkurt, 2025) compared to traditional mega-universities serving over one hundred thousand students each (Daniel, 2013). The platform’s unique all-in-one infrastructure and the highly heterogeneous learner profile of Open Education Faculty (OEF) require a multidimensional approach to evaluating the user experience. However, existing e-learning satisfaction scales frequently suffer from contextual validity issues because they have been developed for generic platforms like Moodle or Blackboard (Aldosemani, 2023; Rokhim et al., 2024; Sharma et al., 2017), making it difficult to collect data for systemic institutional improvements.
The current study aims to create a scale to measure learner experience and satisfaction specifically for the Anadolu LMS, applicable to any other mega/giga university or open university. The scale development follows the strict psychometric principles outlined by DeVellis (2012), Hinkin et al. (1997), Netemeyer et al. (2003), and Germain (2006). However, beyond a mere contextual application, this study theoretically contributes to the literature by synthesising distinct frameworks. While traditional methods usually treat the Technology Acceptance Model (TAM) (Davis, 1989) and the Information System Success Model (DeLone & McLean, 2003) separately, this study suggests a unified theoretical structure. It connects measures of technical acceptance (such as usability and system quality) with educational and social factors (like social influence and perceived learning). This approach provides a broader view of how to measure learner experience in large-scale open and distance learning settings (Rokhim et al., 2024; Thanh et al., 2024).
Evaluating learner experience and satisfaction in open, online, and distance learning (O-ODL) systems serves as an indirect measure of system success, directly impacting performance, engagement, and continuance intention (Wei & Chou, 2020). Research in this domain has historically relied on the TAM (Davis, 1989) and the Information System Success Model (DeLone & McLean, 2003) to explain how technical indicators—such as system quality, service quality, perceived usefulness, and ease of use—shape user attitudes (Aldosemani, 2023). More recent literature emphasises that technical features alone cannot fully explain satisfaction (Thanh et al., 2024; Yang, 2024). Integrating these foundational models with psychosocial frameworks captures vital non-technical elements like learning motivation, interaction quality, and visual flow (Thanh et al., 2024; Yang, 2024). For instance, El Sayad (2024) integrated the TAM and the Community of Inquiry (CoI) framework, establishing that pedagogical, cognitive, and social presences intersect with system attributes to determine overall learner satisfaction.
A comprehensive literature review reveals that general e-learning satisfaction instruments often suffer from contextual validity issues because they are typically developed independently of institutional environments or tailored to specific platforms (Aldosemani, 2023; Rokhim et al., 2024; Sharma et al., 2017). While existing studies address separate parameters—such as organisational technology acceptance (Rokhim et al., 2024), system and service quality impacts (Sharma et al., 2017), or general flow effects on mobile learning satisfaction (Thanh et al., 2024; Yang, 2024)—they frequently overlook platform-specific architectures.
To bridge this theoretical and contextual gap, this study synthesises technical acceptance models with open distance education characteristics, defining a multidimensional framework across nine distinct domains:
Consequently, the boundary conditions of this study were guided by a central question: To what extent can learner experience and satisfaction in the context of the Anadolu LMS platform be measured validly and reliably using the newly developed measurement instrument?
Consequently, based on this theoretical synthesis, the research questions of this study were structured as follows:
This study, which aimed to develop a valid and reliable psychometric measurement tool, was structured as a cross-sectional survey within a descriptive model located in the quantitative research paradigm. As Creswell (2012) states, this design allowed for measuring the tendencies, attitudes, or perceptions of a specific population at a single point in time (the summer semester of the 2024-2025 academic year) and for statistically analysing the relationships among the variables that shaped these perceptions.
The scale was developed following the psychometric guidelines proposed by DeVellis (2012), Germain (2006), Hinkin et al. (1997), and Netemeyer et al. (2003) to ensure a theoretically sound, valid, and reliable instrument. First, a comprehensive literature review on e-learning, LMS usage, and user satisfaction was conducted to establish a conceptual framework grounded in the TAM and the Information System Success Model (DeLone & McLean, 2003). Based on this foundation, an initial factor pool was generated. To ensure content validity, four open and distance learning academic experts reviewed the potential factors; only the nine dimensions that strictly aligned with the research context were retained.
Following theoretical boundary definitions, an initial pool of 35 items across nine factors was generated based on the relevant literature. Content validity was evaluated by four open and distance learning experts using the Lawshe (1975) technique. Experts rated items from 1 (not applicable) to 4 (fully applicable), with scores of 3 and 4 operationalised as adequate representation. The decision rule required full expert consensus (all scoring 3 or 4), yielding a Content Validity Ratio (CVR) and Content Validity Index (CVI) of 1.00 for all retained items. Non-compliant items were removed, reducing the instrument to a 27-item draft. In the second phase, two psychometric experts refined the items for language, clarity, and measurability. Final item syntax was adjusted following student interviews where learners read items aloud to identify ambiguities. The resulting scale items were operationalised as statements utilising a 5-point Likert response format ranging from 1 (strongly disagree) to 5 (strongly agree). A two-step pretesting protocol was then implemented. First, a focus group of 10 experienced LMS users participated in structured cognitive interviews to verify item clarity and interpretability (DeVellis, 2012). Students reported that the wording was clear, necessitating no substantive revisions. Second, the questionnaire was pilot-tested with 100 students to examine preliminary internal consistency (Hair et al., 2014). Dimension-level Cronbach’s alpha values ranged from 0.80 to 0.91, indicating strong preliminary reliability and confirming instrument readiness for main data collection.
The study population comprised open, online, and distance learning (O-ODL) students at Anadolu University’s Open Education Faculty during the summer semester of the 2024-2025 academic year. Purposive, criterion-based sampling was utilised to select participants with sufficient exposure to evaluate the platform meaningfully. Inclusion criteria required an active institutional learning management system (LMS) account and verified minimum platform usage, defined as logging in, using at least one item of learning material, and participating in live classes during the semester. To meet the psychometric recommendation of at least 10 participants per item, the target sample size was established at a minimum of 270 participants for the 27-item instrument (DeVellis, 2012; Tabachnick & Fidell, 2012).
Data collection was conducted online through the LMS platform over a 20-day period. The study was approved by the Anadolu University Social and Human Sciences Scientific Research and Publication Ethics Committee. Prior to starting the survey, participants reviewed an information sheet regarding anonymity, confidentiality, and voluntary participation, and provided digital informed consent via a mandatory checkbox; no monetary or academic incentives were provided.
To verify eligibility objectively without compromising anonymity, system-generated student aliases were temporarily used to cross-reference institutional platform usage data. These identifiers were restricted to the research team and completely removed from the analytic workflow following verification. A total of 715 students voluntarily completed the survey. Because the system enforced responses to all items, there was no missing data from item nonresponse. However, rigorous screening criteria were applied: 98 respondents were excluded for failing to meet the minimum platform usage criteria, and 44 were removed due to compromised response integrity, which was operationalised as failed attention checks or uniform responding across items. This process yielded a final sample size of 573 valid responses, exceeding the minimum sample requirement.
When examining the demographic characteristics of the participants, the gender distribution was 55.1% female (n = 316), 43.3% male (n = 248), and 1.6% (n = 9) who did not specify their gender. The age distribution was 33.2% aged 18-29 (n = 190), 27.7% aged 30-39 (n = 159), 21.8% aged 40-49 (n = 125), and 17.3% aged 50 and above (n = 99). By programme type, 47.8% were enrolled in bachelor’s degree programmes (n = 274), 45.7% in associate degree programmes (n = 262), and 6.5% in certificate programmes (n = 37). Considering the type of registration at the Open Education Faculty, 60.7% were registered under the Second University programme (n = 348), 22.2% through the VTE (Vertical Transfer Exam)/bachelor’s degree completion (n = 127), and 17.1% through the UEE (University Entrance Exam) (n = 98).
In the data analysis process, preliminary examinations were first conducted on the scale items. In this regard, in addition to calculating descriptive statistics, skewness and kurtosis were examined to assess normality. Furthermore, item-total correlation coefficients were calculated to evaluate the items’ discriminative power and their representation of factor integrity. Subsequently, following the approach of Fabrigar et al. (1999), the data set was randomly split into two. The first data set was used for an EFA, and the second for a CFA. Finally, Cronbach’s Alpha (α) internal consistency coefficient was calculated on the entire data set to evaluate the reliability of the scale.
Prior to factor analyses, responses were screened for completeness and response quality. Cases with missing item responses were removed using list-based deletion at the data cleaning stage. After these exclusions, the retained dataset contained no item-level missing values for the analyses. Following the cross-validation approach recommended for scale development, the dataset was randomly split into two independent subsamples (Fabrigar et al., 1999). The first subsample (n = 286) was used for EFA to identify the underlying factor structure, and the second subsample (n = 287) was used for CFA to test the derived measurement model. Reliability was then evaluated based on the full dataset (n = 573). Item-level screening included item-total correlations and distributional checks. Reliability and validity evidence were evaluated using internal consistency indices and model fit/construct validity indicators are reported below.
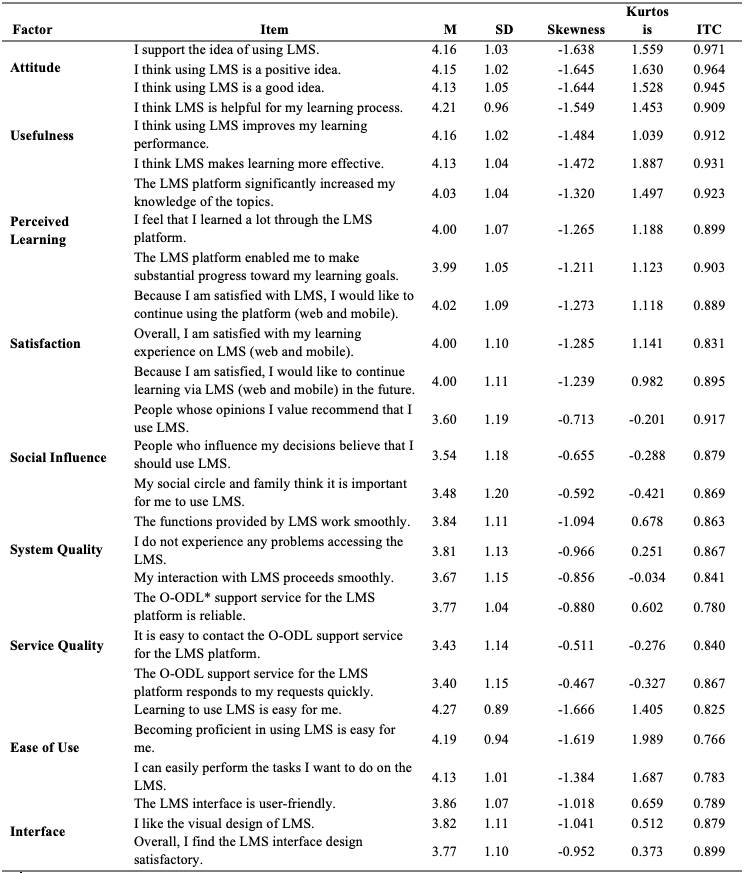
After administering the scale, descriptive statistics, normality assumptions, and item validity were first examined. Accordingly, the mean, standard deviation, skewness, kurtosis, and item-total correlation (ITC) values were calculated for each item and are presented in Table 1.
Table 1: Descriptive Statistics and Preliminary Analyses of the Scale Items
*O-ODL: Open Online and Distance Learning
Item-level skewness and kurtosis coefficients fell well within the thresholds proposed by Kim (2013) (absolute values < 2 and < 7, respectively), satisfying univariate normality assumptions. Item-Total Correlations (ITCs) were examined to evaluate item discrimination, where the literature identifies values ≥ 0.40 as sufficient (Hair et al., 2014). The scale’s ITCs ranged from 0.76 to 0.97, performing substantially above this minimum benchmark. Specifically, ITCs exceeded 0.94 for “Attitude”, reached ≥ 0.88 for “Usability,” “Perceived Learning,” and “Satisfaction,” and ranged from 0.76 to 0.92 for the remaining dimensions. Because no items fell below the 0.40 threshold, the complete 27-item architecture was preserved for EFA and CFA.
Common Method Bias
Because the data were collected via a single self-report survey administered at one time point (n = 573), we assessed common method bias using Harman’s single-factor test and a common latent factor (CLF) analysis. Nine factors exhibited eigenvalues greater than 1, and the largest proportion of variance explained by a single factor was 17.57%. In addition, the CLF assessment indicated that standardised regression weights differed by less than 0.20 between the measurement model with and without the CLF. Taken together, these results suggest that common method bias is unlikely to materially affect the study findings (Fuller et al., 2016; Harman, 1976).
Exploratory Factor Analysis (EFA)
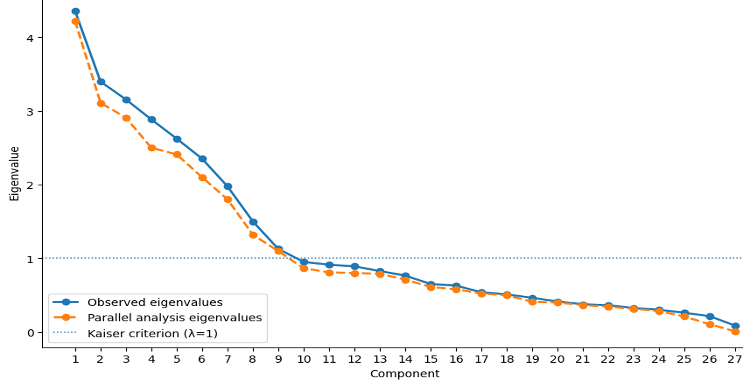
To evaluate the structural composition of the scale, an EFA was performed on the first dataset split (n = 286). Following the framework outlined by Nunnally (1978), the initial factor analysis confirmed that all targeted dimensions satisfied the conditions for multidimensional structural integrity. To objectively determine the correct number of retention factors rather than relying on subjective metrics, a parallel analysis was conducted by contrasting the empirical eigenvalues against those derived from random datasets of identical dimensions (DeVellis, 2012). The first nine empirical eigenvalues exceeded their corresponding random control values, whereas the tenth and all subsequent factors failed to clear this threshold. This statistical scree configuration (Figure 1) provides transparent quantitative evidence supporting the nine-factor framework, showing that the scale’s structural distribution is both theoretically sound and empirically validated.
To reveal the factor structure, Principal Component Analysis (PCA) was used for extraction, and Varimax rotation was used. As a result, sampling adequacy was supported by a high overall KMO value (KMO = 0.963) and a significant Bartlett’s test of sphericity (χ²(351) = 10314.279, p < 0.001) (Hair et al., 2014). These findings are presented in Table 2.
Table 2: Results of Bartlett’s Test of Sphericity and the KMO Measure of Sampling Adequacy

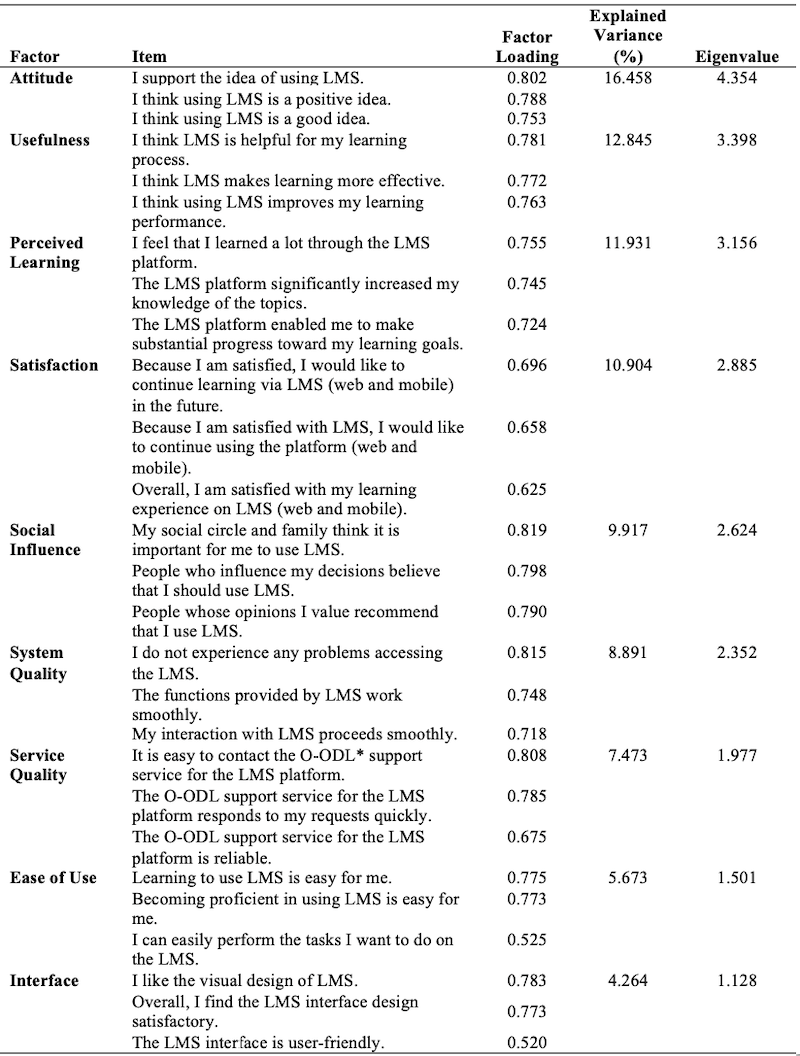
Factor loading is a value that indicates how closely the items on a scale are related to the factor measured by that scale (Hair et al., 2014). The factor loadings obtained as a result of the EFA, along with the total variance explained values and eigenvalues, are shared in Table 3.
Table 3: EFA Findings
*O-ODL: Open Online and Distance Learning
Table 3 shows that the item loadings for the factors range from 0.520 to 0.819. Two items showed comparatively lower loadings, namely “The LMS interface is user-friendly” (Interface, 0.520) and “I can easily perform the tasks I want to do on the LMS” (Ease of Use, 0.525). Although a 0.70 threshold is often recommended for established scales, in early-stage scale development, loadings above 0.50 can be acceptable when items are theoretically central and when the overall factor solution is stable (Hair et al., 2014). Therefore, these items were retained because they represent core content coverage for their constructs. As an additional robustness check, we re-estimated the EFA after removing each low-loading item. The nine-factor structure and the substantive interpretation of the factors remained unchanged, and model interpretability did not improve. Hence, the original item set was preserved to maintain content validity. On the other hand, it is observed that the total variance explained values are above 50%, while the eigenvalues are also above 1.0. In summary, the EFA findings indicate that all values are distributed at a sufficient level (Hair et al., 2014).
Confirmatory Factor Analysis (CFA)
To evaluate the structural validity of the nine-factor framework identified during the exploratory stage, a CFA was performed on the second independent data split (n = 287). This cross-validation technique directly tests the model-data fit to verify how accurately the sub-dimensions measure the intended scale characteristics (Hair et al., 2014). Goodness-of-fit indices were evaluated against conventional psychometric cut-off thresholds, consulting Hu and Bentler (1999) for CFI and TLI, and Tabachnick and Fidell (2012) for RMSEA and SRMR.
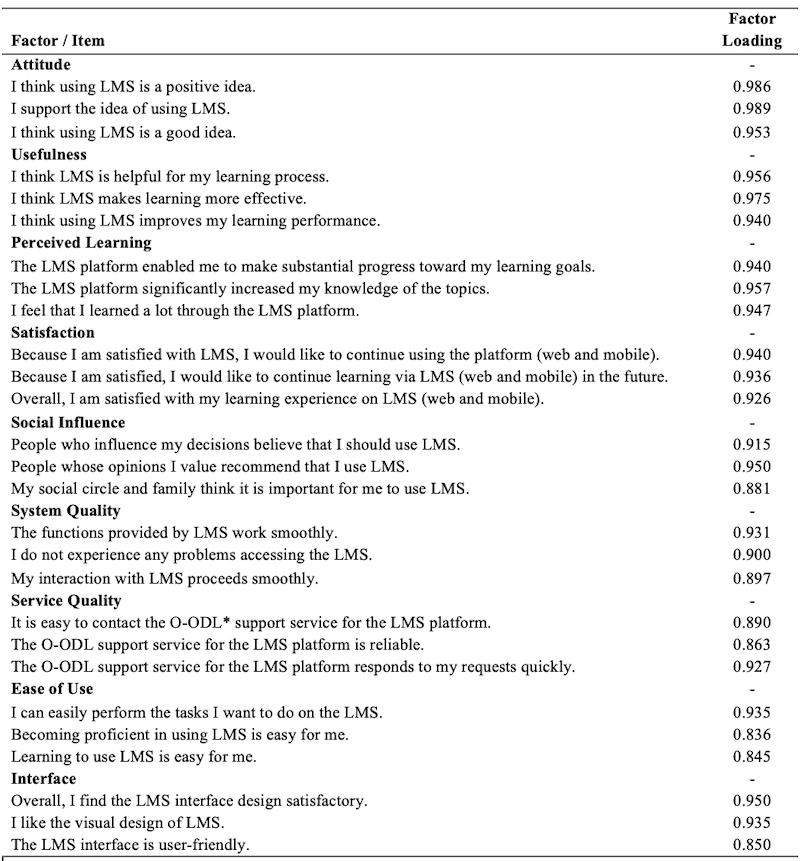
Table 4 shows factor loadings ranging from 0.845 to 0.986. Factor loadings obtained from CFA, in other words, standardised loading estimates, should be at least 0.50 or ideally 0.70 (Hair et al., 2014). In this regard, the factor loadings are sufficiently high, indicating strong item-factor relationships in the confirmatory stage.
Table 4: Factor Loadings for the CFA Factor Loading
*O-ODL: Open Online and Distance Learning
CFA supported the nine-factor measurement model with acceptable fit (χ²/df = 2.440, CFI = 0.960, TLI = 0.951, SRMR = 0.046, RMSEA = 0.075) (Hu & Bentler, 1999; Tabachnick & Fidell, 2012) (Table 5). Modification indices were examined to identify potential areas of misfit. No post-hoc model re-specifications were introduced because the initial model already demonstrated acceptable fit, and additional modifications lacked clear theoretical justification (Hair et al., 2014). The construct validity assessment conducted for the scale is presented in Tables 6 and 7.
Table 5: Model Fit Indices for the Scale

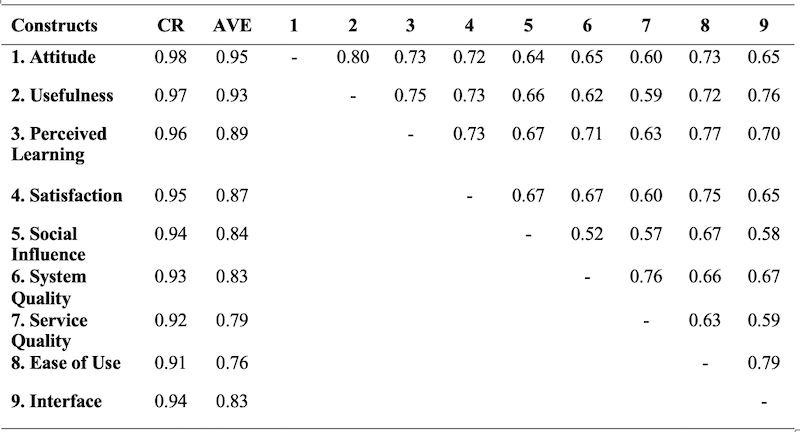
Table 6: Assessment of the Scale’s Construct Validity (CR, AVE and HTMT Values)
 -
-
Table 7: Correlation Values
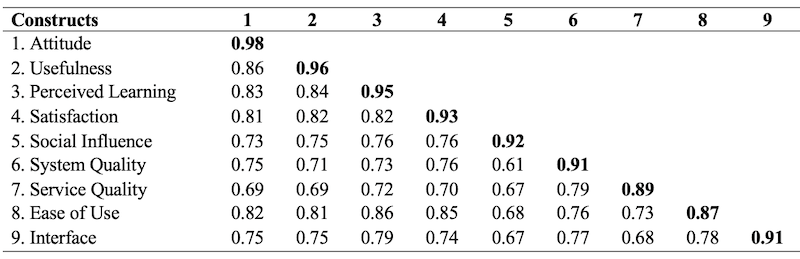
Note: Diagonal bold values indicate the square roots of AVE. Values below the diagonal report inter-construct correlations.
Construct validity was assessed through convergent and discriminant validity. For convergent validity, Composite Reliability (CR) and Average Variance Extracted (AVE) values were examined and found to exceed the recommended thresholds (CR > 0.70, AVE > 0.50), indicating that related items loaded on their intended factors and convergent validity was established. Discriminant validity was evaluated using the Fornell and Larcker (1981) criterion, which requires the square root of a construct’s AVE to be greater than its correlations with other constructs (the values on the diagonal in Table 7). The square root values were higher than the inter-construct correlations, showing that the nine factors were sufficiently distinct and discriminant validity was achieved. Although several inter-factor correlations were high (approaching 0.86), that pattern was to some extent expected given the conceptual proximity of constructs in the TAM and IS Success frameworks (Davis, 1989; DeLone & McLean, 2003). We conducted additional checks to further probe discriminant validity (Table 6). First, the Heterotrait-Monotrait ratio (HTMT) values ranged from 0.52 to 0.80, staying below the stricter 0.85 threshold and well below 0.90, which supports discriminant validity (Henseler et al., 2015). Second, we tested an alternative collapsed-factor (single-factor) measurement model that combines conceptually proximate constructs. This alternative model showed poor fit (χ²/df = 5.440, CFI = 0.760, TLI = 0.651, SRMR = 0.189, RMSEA = 0.209), whereas the correlated nine-factor model demonstrated good fit (χ²/df = 2.440, CFI = 0.960, TLI = 0.951, SRMR = 0.046, RMSEA = 0.075). Overall, the results favour retaining the nine distinct factors as the more plausible representation (Henseler et al., 2015). Therefore, since both convergent and discriminant validity were met, the developed scale demonstrated construct validity (Hair et al., 2014).
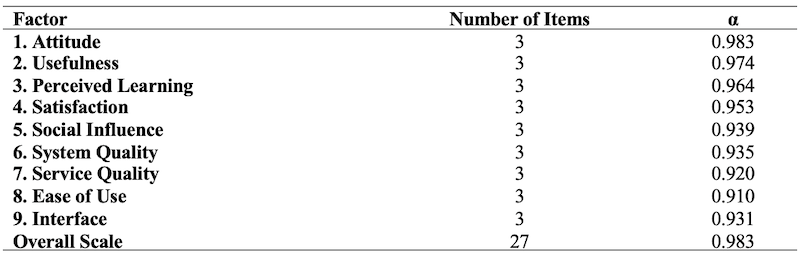
The findings in Table 8 show that the α coefficients for the scale’s factors and the overall scale are above the 0.70 threshold, indicating that the factors are reliable (Hair et al., 2014). Internal consistency was also high across constructs and for the overall scale (overall α = 0.983). Although very high alpha values can sometimes reflect item redundancy and should be interpreted with caution, the scale is multidimensional, and each construct contains three items designed to capture complementary aspects of the domain (Hair et al., 2014). The consistently strong CR and AVE values also support reliable and coherent measurement and convergent validity (Fornell & Larcker, 1981).
Table 8: Reliability Analysis Results
The primary objective of this study was to develop a valid and reliable scale to measure learner experience and satisfaction in the Anadolu LMS. Drawing on the systematic scale development steps proposed by DeVellis (2012) and Hinkin et al. (1997) and grounded in the TAM and the IS Success Model (DeLone & McLean, 2003), the study yielded a 27-item instrument with nine dimensions: Attitude, Usefulness, Perceived Learning, Satisfaction, Social Influence, System Quality, Service Quality, Ease of Use, and Interface. EFA and CFA results indicated strong structural validity, and the scale demonstrated very high internal consistency (Cronbach’s alpha, α = 0.983).
These findings support a multidimensional understanding of O-ODL satisfaction, showing that learner experiences cannot be reduced to purely technical variables. Instead, platform infrastructure stability (System Quality) and the responsiveness of support mechanisms (Service Quality) intersect tightly with cognitive, affective, and social factors—such as perceived learning, learner attitudes, and social influence—to determine overall engagement and continuance intentions (Aldosemani, 2023; El Sayad, 2024; Rokhim et al., 2024; Thanh et al., 2024; Wei & Chou, 2020; Yang, 2024). This integration is particularly vital in a large-scale giga-university environment like the Anadolu LMS, where face-to-face contact is limited and a highly heterogeneous student population relies on platform-based self-regulation, instructional presence, and community support structures to thrive.
This study establishes a socio-technical, multidimensional framework for understanding learner satisfaction in large-scale online ecosystems, demonstrating that user experience cannot be reduced to technical performance or system quality alone. Theoretically, the validation of this robust 27-item scale reinforces that satisfaction emerges from the joint operation of cognitive (perceived learning), affective (attitude), social (social impact), and service factors. Practically, the instrument serves as a strategic diagnostic dashboard for quality assurance at Anadolu University’s Open Education Faculty, shifting institutional focus from basic LMS acceptance toward crucial environmental structures like support service responsiveness and social influence. By enabling decision-makers to identify dimension-level bottlenecks across large, heterogeneous student populations, this tool facilitates targeted resource allocation, data-driven improvements, and cross-institutional benchmarking to ensure long-term system success in the global mega-university sector.
Several limitations qualify the findings of this study. First, data collection was restricted to a single institution within Türkiye, meaning satisfaction and technology acceptance metrics may vary across alternative cultural or institutional landscapes (El Sayad, 2024; Wei & Chou, 2020). Second, the cross-sectional design captured only the summer semester of the 2024-2025 academic year, leaving temporal stability unexamined as the dynamic learning management system (LMS) undergoes periodic updates. Third, the reliance on perceptual self-report data introduced potential alignment issues with actual usage indicators (Akbulut et al., 2023). Finally, a gender distribution imbalance (55.1% female, 43.3% male) resulting from self-selection could have affected instrument responses.
These limitations highlight clear paths for subsequent research. Future investigations should deploy more controlled sampling methods and establish cross-cultural generalisability. The evidence base would be significantly strengthened by triangulating survey responses with objective platform log data or digital footprints. Methodologically, running longitudinal designs would verify the scale’s temporal consistency and allow researchers to execute measurement invariance testing across demographic groups.
Akbulut, Y., Saykılı, A., Öztürk, A., & Bozkurt, A. (2023). What if it’s all an illusion? To what extent can we rely on self-reported data in open, online, and distance education systems? The International Review of Research in Open and Distributed Learning, 24(3), 1-17. https://doi.org/10.19173/irrodl.v24i3.7321
Aldosemani, T.I. (2023). A technology-acceptance-model-based study of the attitudes towards learning management systems among teachers during the COVID-19 pandemic. International Journal of Online Pedagogy and Course Design, 13(1), 1-22. https://doi.org/10.4018/ijopcd.325240
Bozkurt, A. (2025). Anadolu University. In S. Mishra & S. Panda (Eds.), Handbook of open universities around the world. Routledge. http://dx.doi.org/10.4324/9781003478195-53
Creswell, J.W. (2012). Educational research: Planning, conducting, and evaluating quantitative and qualitative research. Pearson.
Daniel, J. (2013). Mega-universities and knowledge media. Routledge. https://doi.org/10.4324/9780203045978
Davis, F.D. (1989). Perceived usefulness, perceived ease of use, and user acceptance of information technology. MIS Quarterly, 13(3), 319-340. https://doi.org/10.2307/249008
DeLone, W.H., & McLean, E.R. (2003). The DeLone and McLean model of information systems success: A ten-year update. Journal of Management Information Systems, 19(4), 9-30. https://doi.org/10.1080/07421222.2003.11045748
DeVellis, R.F. (2012). Scale development: Theory and applications (3rd ed.). Sage Publications.
El Sayad, G. (2024). Higher education students’ learning perception in the blended learning community of inquiry. Journal of Computers in Education, 11(4), 1061-1088. https://doi.org/10.1007/s40692-023-00290-y
Fabrigar, L.R., Wegener, D.T., MacCallum, R.C., & Strahan, E.J. (1999). Evaluating the use of exploratory factor analysis in psychological research. Psychological Methods, 4(3), 272-299. https://doi.org/10.1037//1082-989x.4.3.272
Fink, A., Spoden, C., & Frey, A. (2023). Determinants of higher education teachers’ intention to use technology-based exams. Education and Information Technologies, 28, 6485-6513. https://doi.org/10.1007/s10639-022-11435-4
Fornell, C., & Larcker, D.F. (1981). Evaluating structural equation models with unobservable variables and measurement error. Journal of Marketing Research, 18(1), 39-50. https://doi.org/10.2307/3151312
Fuller, C.M., Simmering, M.J., Atinc, G., Atinc, Y., & Babin, B.J. (2016). Common methods variance detection in business research. Journal of Business Research, 69(8), 3192-3198. https://doi.org/10.1016/j.jbusres.2015.12.008
Germain, M.L. (2006). Stages of psychometric measurement development: The sample of the generalized expertise measure (GEM). Paper presented at the Academy of Human Resource Development International (AHRD) Conference, Columbus, Ohio, 22-26 February 2006 (pp. 893-898). https://files.eric.ed.gov/fulltext/ED492775.pdf
Hair, J.F., Black, W.C., Babin, B.J., & Anderson, R.E. (2014). Multivariate data analysis (Pearson New International Edition). Pearson.
Harman, H.H. (1976). Modern factor analysis (3rd ed.). University of Chicago Press.
Henseler, J., Ringle, C.M., & Sarstedt, M. (2015). A new criterion for assessing discriminant validity in variance-based structural equation modeling. Journal of the Academy of Marketing Science, 43(1), 115-135. https://doi.org/10.1007/s11747-014-0403-8
Hinkin, T.R., Tracey, J.B., & Enz, C.A. (1997). Scale construction: Developing reliable and valid measurement instruments. Journal of Hospitality & Tourism Research, 21(1), 100-120. https://doi.org/10.1177/109634809702100108
Hu, L-t., & Bentler, P.M. (1999). Cutoff criteria for fit indexes in covariance structure analysis: Conventional criteria versus new alternatives. Structural Equation Modeling: A Multidisciplinary Journal, 6(1), 1-55. https://doi.org/10.1080/10705519909540118
Kim, H-Y. (2013). Statistical notes for clinical researchers: Assessing normal distribution (2) using skewness and kurtosis. Restorative Dentistry & Endodontics, 38(1), 52-54. https://doi.org/10.5395/rde.2013.38.1.52
Lawshe, C.H. (1975). A quantitative approach to content validity. Personnel Psychology, 28, 563-575. https://doi.org/10.1111/j.1744-6570.1975.tb01393.x
Netemeyer, R.G., Bearden, W.O., & Sharma, S. (2003). Scaling procedures: Issues and applications. SAGE Publications, Inc. https://doi.org/10.4135/9781412985772
Nunnally, J.C. (1978). An overview of psychological measurement. Clinical diagnosis of mental disorders: A handbook (pp. 97-146). Springer.
Rokhim, R., Mayasari, I., Wulandari, P., & Haryanto, H.C. (2024). Analysis of the extrinsic and intrinsic aspects of the technology acceptance model associated with the learning management system during the COVID-19 pandemic. VINE Journal of Information and Knowledge Management Systems, 54(6), 1289-1314. https://doi.org/10.1108/VJIKMS-04-2022-0113
Sharma, S.K., Gaur, A., Saddikuti, V., & Rastogi, A. (2017). Structural equation model (SEM)-neural network (NN) model for predicting quality determinants of e-learning management systems. Behaviour & Information Technology, 36(10), 1053-1066. https://doi.org/10.1080/0144929X.2017.1340973
Tabachnick, B., & Fidell, L. (2012). Using multivariate statistics (Global Edition). Pearson.
Thanh, L.P., Trang, T.N.Q., Minh, N.N., & Van Hai, H. (2024). Key determinants of student satisfaction in online learning during COVID-19: Evidence from Vietnamese students. Human Behavior and Emerging Technologies, 2024, 1-14. https://doi.org/10.1155/2024/5560967
Wei, H-C., & Chou, C. (2020). Online learning performance and satisfaction: Do perceptions and readiness matter? Distance Education, 41(1), 48-69. https://doi.org/10.1080/01587919.2020.1724768
Yang, X. (2024). Mobile learning application characteristics and learners' continuance intentions: The role of flow experience. Education and Information Technologies, 29(2), 2259-2275. https://doi.org/10.1007/s10639-023-11910-6
Author Notes
Dr Yusuf Zafer Can Uğurhan is a faculty member at Anadolu University, Faculty of Communication Sciences. His research focuses on communication studies, social media, and open and distance learning, with expertise in quantitative and qualitative methods. Email: yzcu@anadolu.edu.tr (https://orcid.org/0000-0003-1264-9002)
Dr Emel Güleris a researcher and faculty member at Anadolu University, Türkiye. With MA and PhD degrees in distance education, Dr. Bozkurt's work focuses on empirical studies in areas such as distance education, online learning, networked learning, and educational technology. He applies critical theories like connectivism, rhizomatic learning, and heutagogy to his research. Dr. Bozkurt is also interested in emerging research paradigms, including social network analysis, sentiment analysis, and data mining. Dr. Bozkurt's studies also cover the integration of artificial intelligence technologies into educational processes in the axis of human-machine interaction. Email: arasbozkurt@gmail.com (https://orcid.org/0000-0002-4520-642X)
Aras Bozkurt is a researcher and faculty member at Anadolu University, Türkiye. With MA and PhD degrees in distance education, Dr. Bozkurt's work focuses on empirical studies in areas such as distance education, online learning, networked learning, and educational technology. He applies critical theories like connectivism, rhizomatic learning, and heutagogy to his research. Dr. Bozkurt is also interested in emerging research paradigms, including social network analysis, sentiment analysis, and data mining. Dr. Bozkurt's studies also cover the integration of artificial intelligence technologies into educational processes in the axis of human-machine interaction. Email: arasbozkurt@gmail.com (https://orcid.org/0000-0002-4520-642X)
Cite as: Uğurhan, Y.Z.C., Güler, E., Bozkurt, A. (2026). Development and validation of a learner experience and satisfaction scale for open online and distance learning. Journal of Learning for Development, 13(3), 497-511.
DOI: https://doi.org/10.56059/80kc2g55