2024 VOL. 11, No. 3
Abstract: In recent years, the growing incidence of blended and online learning has highlighted instructional design concerns, especially STEM instructional design. Existing studies have often adopted observations, questionnaires, or interviews to evaluate STEM instructional design plans. However, there is still a lack of quantitative, measurable, and objective assessment methods. To close this research gap, this study proposes an innovative method for assessing STEM instructional design plans based on information flows. In this study, 20 STEM instructional design plans were designed, analysed, and assessed using the proposed information flow-based assessment method. The results indicated that the proposed method is feasible and effective for assessing STEM instructional design plans. STEM instructional design plans could be significantly improved based on the proposed method. The results and implications for instructors and practitioners are discussed in depth.
Keywords: STEM, instructional design, assessment method, information flow
Recently, the growing interest in STEM (science, technology, engineering, and mathematics) has highlighted the importance of STEM instructional design. However, the quality of STEM education varies greatly in current STEM practices. This makes it challenging to fully embody STEM philosophy (Sánchez Carracedo et al., 2018). In previous studies, it has been found that STEM instructional design plan quality directly influenced the effectiveness of teaching and learning performance (Pellas et al., 2020). STEM instructional design plans are planning schemes created by teachers based on instructional objectives, content, and learners’ characteristics. Well-designed STEM instruction design plans are essential for improving STEM quality and developing STEM curriculum frameworks (Aldemir & Kermani, 2017). However, most studies used qualitative methods such as observations, questionnaires, or interviews to assess STEM instructional design plans (Aydin Gunbatar et al., 2022; Han et al., 2015).
Current research on the assessment of STEM instructional design is still in the exploratory stage, with limited related studies. Furthermore, researchers have revealed that quantitative assessment methods allow for precise observation, measurement, and achieve generalised findings based on representative samples (Denscombe, 2010; Schilderman, 2011). However, there is a lack of quantitative assessment methods for STEM instructional design plans.
The information flow is defined as information output by teachers, students, and instructional media in an instructional design system (Yang, 2007). The information flow approach considers an instructional system as an information system and focuses on information flows within the instructional system, which facilitate the objective analysis and assessment of instructional processes and outcomes (Yang & Zhang, 2009). Since STEM instruction design is considered as an instruction system, it is appropriate to adopt the information flow approach to assess STEM instructional design quality. However, very few studies have employed the information flow approach to assess STEM instructional design plans. To address these research gaps, this study aims to propose and validate an innovative and quantitative method to assess STEM instructional design plans based on information flows.
The research questions were as follows:
Instructional design focuses on the analysis of the problems, design, development, and evaluation of instructional processes to improve learning (Reiser, 2001). As a design-oriented theory, an instructional design theory should provide explicit guidance on how to help people learn and develop learning goals, learning content, instructional methods, situations, and expected outcomes (Reigeluth, 2013). STEM instructional design plans represent teachers’ ideas for implementing STEM instruction activities. Wilson (2018) found that high-quality STEM instructional design plans include deep content knowledge, strong connections among different areas, specific assessment criteria, and collaborations among teachers and students.
Previous studies mainly adopted qualitative methods to assess STEM instructional design plans (Aykan & Yıldırım, 2021; Han et al., 2015). Typically, the qualitative assessment method has been the primary approach to assessing STEM instructional design plans. This approach mainly relies on specific rubrics or criteria to assess the quality of instructional design plans. For example, Aykan and Yıldırım (2021) qualitatively analysed STEM instructional design plans using developed assessment criteria that included professional skills, STEM multidisciplinary integration, 21st-century skills, and attitudes and values. Han et al. (2015) used a STEM lesson plan evaluation, five-point scale, observation, and interviews to assess STEM instructional design plans.
Instructional design plans play a crucial role in enhancing the effectiveness of STEM instruction. Existing studies have adopted various assessment criteria, questionnaires, observation descriptions, or interview protocols to assess STEM instructional design plans (Aykan & Yıldırım, 2021; Han et al., 2015). However, these assessment methods are relatively vague and prone to subjectivity (Mohajan, 2018). There is a lack of quantitative methods for assessing STEM instructional design plans. To close this research gap, this study aimed to propose an innovative method based on information flows to assess STEM instructional design plans. The following section illustrates the theoretical framework.
The main theoretical framework of this study was built upon the idea that an instructional system is considered a complex information system. An instructional system is an information system in which the information output by teachers, students, and instructional media flow and interact with each other (Yang, 2007). To better understand complex educational phenomena and their effects, it is necessary to pay attention to information flows within a system and its overall characteristics, as well as the relationships between information flows and the functionalities of the system (Yang & Zhang, 2009). Instructional design plans can represent the static attributes of an instruction system. Therefore, it is appropriate to adopt the information flow approach to analyse the quality of instructional design plans. This study aimed to examine a method of assessing STEM instructional design plans based on the information flow approach.
This study has adopted the information flow-based analysis method proposed by Yang (2007). The research object of this study was the information flows of STEM instructional design plans. This study focused on analysing the information flows of STEM instructional design plans in two rounds. In the first round, pre-service teachers designed 10 STEM instructional design plans. Then they revised these plans based on the assessment results of the first round to form 10 optimised STEM instructional design plans for the second round. The purpose of designing STEM instructional design plans in two rounds was to examine the effectiveness of the proposed assessment method. Since the pre-service teachers revised the STEM design plans and found significant changes using the assessment method, this meant that our assessment method was able to effectively respond to changes in the quality of the STEM instructional design plans.
The research procedure consisted of five steps. First, pre-service teachers who had taken an instructional design course were invited to design STEM instructional design plans. The instructional design course is a compulsory course pre-service teachers need to graduate from university. The course covers the knowledge and skills needed for instructional design. The pre-service teachers get credit if they pass the examination. Second, assessment methods for STEM instructional design plans were developed. Third, STEM instructional design plans were analysed and assessed by two experienced researchers in STEM education based on the developed method. Fourth, the researchers and pre-service teachers conducted a face-to-face discussion about the points raised in the analysis and assessment. Then the STEM instructional design plans were optimised based on the assessment results of the first round to form STEM instructional design plans for the second round. Fifth, the statistical analysis method was used to examine the differences in instructional design plans between the first and second rounds.
This study adopted the convenient sampling method to select participants. The present study invited two pre-service teachers, who had rich experience in instructional design and STEM, to design 20 STEM instructional design plans of two rounds each. They designed STEM instructional design plans based on textbooks, reference books about STEM, and instructional materials for STEM. It should be noted that the research object of this study was the information flows of STEM instructional design plans rather than those of pre-service teachers, since this study adopted the information flow approach to analyse and assess the STEM instructional design plans.
This study collected 20 STEM instructional design plans as the data source. The method of analysing and assessing STEM instructional design plans involved three steps: portraying a knowledge graph based on instructional objectives, coding the information flows of the instructional plan, and developing and calculating assessment indicators of STEM instructional design plans. Taking “designing a Mars base” as an example, the three steps are described below.
The First Step: Portraying a Knowledge Graph Based on Instructional Objectives
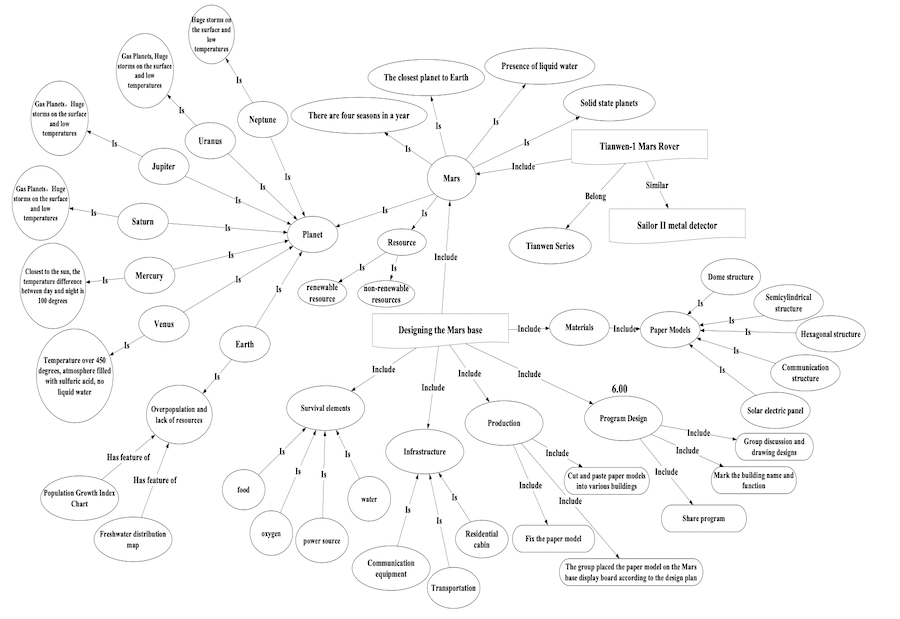
The knowledge graph consisted of the target knowledge and relationships; it is also called the target knowledge graph. Figure 1 shows the target knowledge graph for designing a Mars base.

The Second Step: Coding the Information Flows of Instructional Design Plans
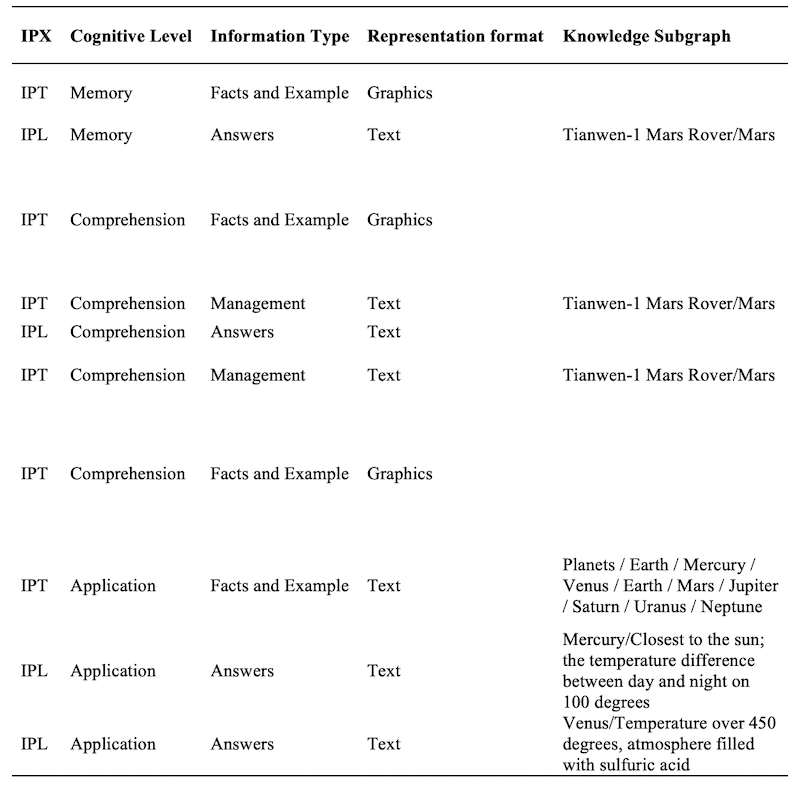
The second step was to segment and code the information flows of STEM instructional design plans. The information was represented as follows: . IPX denotes the information processing by X. X represents teachers (T) or learners (L). IPT denotes the information processing of teachers, and IPL denotes the information processing of learners. Cognitive levels include memory, comprehension, and application. Information types include knowledge semantics, context information, and management instructions. Representation formats include texts, pictures, video, audio, and animation. The knowledge subgraph denotes the graph matched to the information of STEM instructional design plans. The knowledge subgraphs can represent the main characteristics of STEM. These five sections refer to the characteristics of STEM to represent how the information flows of STEM instructional design plans were processed. Table 1 shows the first section, the segmentation of information flows.
Table 1: Segmentation of Information Flows
The Third Step: Developing and Calculating Assessment Indicators of STEM Instructional Design Plans
In this study, the authors developed six indicators and adapted two other indicators to assess STEM instructional design plans, including alignment between the instructional objectives and task design (Zheng et al., 2021), diversity of instructional media (Zheng et al., 2021), adaptability of instructional objectives (Zheng et al., 2021), adaptability of tasks (Zheng et al., 2021), completeness of information types (Yang & Zhang, 2015), activation quantity of the knowledge graph (Zheng, 2017), the contribution degree of learners (He et al., 2020), and the integration degree of STEM. These eight indicators are necessary for assessing STEM instruction design plans since they are crucial elements of instruction design.
Using “designing a Mars base” as an example, the following section illustrates the eight indicators one by one. The alignment between instructional objectives and task design (GC) represents the extent to which instructional objectives and task design were consistent with each other. In this study, the algorithm proposed by Zheng et al. (2021) was adopted to calculate the alignment between instructional objectives and task design, as shown in Formula (1). Each instructional objective had at least one task associated with it. For example, one of the instructional objectives was to understand the composition of a Mars base. Then a designed task was to design and construct a Mars base with group members. In this study, the proposed algorithm was examined in the STEM learning domain. In Formula (1), n(K1) and n(K2) denote the number of nodes in the target knowledge graph and the knowledge graph activated by tasks, respectively, and m(K1) and m(K2) denote the number of edges of the target knowledge graph and the knowledge graph activated by tasks, respectively. The edges of the knowledge graph represent the relationships among knowledge. If an information flow in the STEM instructional design plan triggered a node in the target knowledge graph, then the knowledge was activated. Taking the STEM instructional design plan of “designing a Mars base” as an example, the number of nodes in the target knowledge graph was 63, namely, n(K1) = 63. The number of nodes in the knowledge graph activated by tasks was 62, namely, n(K2) = 62. The number of common nodes between the two knowledge graphs was n(K1∩K2) = 62. The number of edges in the target knowledge graph that connected at least one edge with the intersection of the two graphs was 62, namely, m(K1) = 62. The number of edges in the knowledge graph activated by tasks was 61, namely, m(K2) = 61. The number of common edges between the two graphs was 61, namely, m(K1∩K2) = 61. Therefore, the alignment between instructional objectives and task design was 0.99.

The diversity of instructional media (DM) indicates the degree of media diversity in the STEM instructional design plan. According to the properties of information entropy, the more the types of information sources, the greater the information entropy (Shannon et al., 1948). This indicator can inform instructional designers on how to elaborately design various kinds of instructional media to improve information entropy and learning performance. In this study, the algorithm proposed by Zheng et al. (2021) was adopted to calculate the diversity of instructional media in STEM learning domains, as shown in Formula (2). In Formula (2), D represents media diversity, and Mi denotes the proportion of different media in the STEM instructional design plan. The proportion is equal to the ratio of the media type representing each information to all media types representing all information. Taking the STEM instructional design plan of “designing a Mars base” as an example, the proportion of pictures was 0.13, namely, M1 = 0.13; the proportion of text was 0.78, namely, M2 = 0.78; the proportion of physical objects was 0.04, namely, M3 = 0.04; and the proportion of video was 0.04, namely, M4 = 0.04. Thus, the diversity of instructional media was 0.72.
![]()
The adaptability of instructional plans aimed to assess whether the level of instructional objectives and tasks could match different levels of learners. The adaptability of instructional plans includes the adaptability of instructional objectives (GA) and the adaptability of tasks (TA). The adaptability of instructional objectives assesses whether STEM instructional objectives can be adapted for different levels of learners. It can be calculated via Formula (3) (Zheng et al., 2021). In Formula (3), Ni represents the number of instructional objectives in each level and N denotes the total number of instructional objectives. In addition, the adaptability of tasks assesses whether STEM tasks can be adapted for different levels of learners. The task adaptability was classified into low adaptability, medium adaptability, and high adaptability. This classification was also adopted by a previous study (Suzan et al., 2021). The task adaptability can be computed via Formula (4) (Zheng et al., 2021). In Formula (4), Ti represents the number of tasks in each level, and T denotes the total number of tasks. Taking the STEM instructional design plan of “designing a Mars base” as an example, there are three adaptability levels of instructional objectives and task adaptability, namely, low, medium, and high. The low adaptability represents that instructional objectives and tasks can match the low level of learners. The medium adaptability represents that instructional objectives and tasks can match the medium level of learners. The high adaptability represents that instructional objectives and tasks can match the high level of learners. The number of instructional objectives at the low adaptability level was two, namely, N1 = 2. The number of instructional objectives at the medium adaptability level was two, namely, N2 = 2. The number of instructional objectives at the high adaptability level was two, namely, N3 = 2. The total number of instructional objectives was 6, namely, N = 6. Therefore, GA = 0.67. In terms of the adaptability of tasks, the number of tasks at the low adaptability level was four, namely, T1 = 4. The number of tasks at the medium adaptability level was three, namely, T2 = 3. The number of tasks at the high adaptability level was 2, namely, T3 = 2. The total number of tasks was nine, namely, T = 9. Thus, the adaptability of tasks was TA = 0.64.

The completeness of information types (IT) represents the extensiveness of the information in STEM instructional design plans. This indicator aims to inform instructional designers how to design multiple information types to deliver rich information. The completeness of information types can be computed using Formula (5) (Yang & Zhang, 2015). In Formula (5), Ri denotes the proportion of different information types in the STEM instructional design plan. Taking the STEM instructional design plan of “designing a Mars base” as an example, the information types include knowledge semantics and management instructions. Knowledge semantics refers to the information about knowledge and its relationships. For example, “there are eight planets in the solar system”, which is classified as knowledge semantics. Management instructions denote the information about instruction management. For example, “Be quiet. Now it is time to present group products.” This is classified as management instruction. The proportion of knowledge semantics was 0.66, namely, R1= 0.66. The proportion of management instructions was 0.24, namely, R2 = 0.24. The proportion of context information was 0.03, namely, R3 = 0.03. The proportion of information about learning objectives was 0.01, namely, R4 = 0.01. Therefore, the completeness of information types was 0.94.

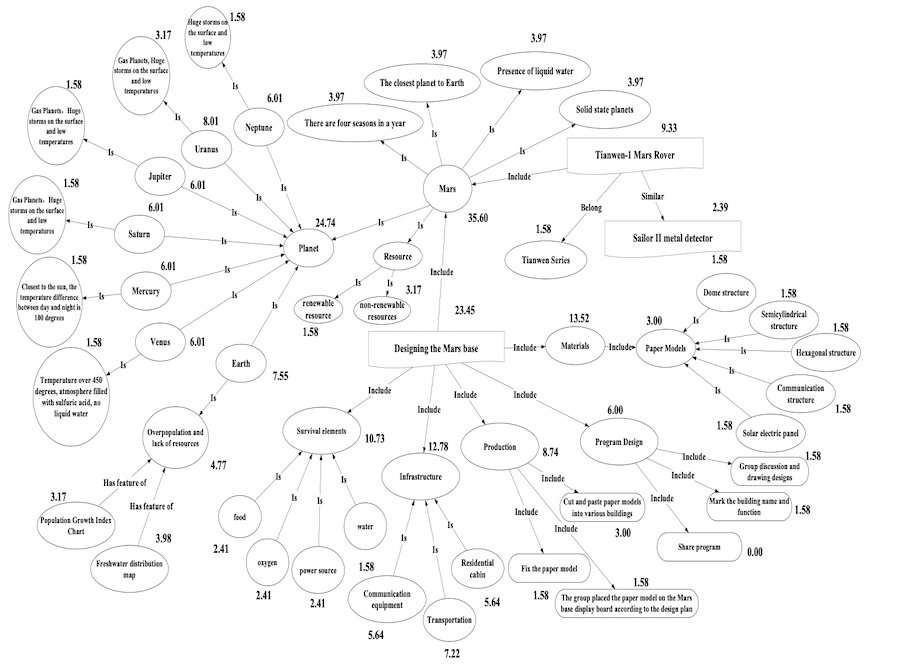
The activation quantity (AQ) of the knowledge graph represents the activation level of all knowledge activated by all information in the STEM instructional design plan. For example, if the semantics of information in the STEM instructional design plan matches the knowledge and relationships in the target knowledge graph, then it will activate the knowledge and relationships. This can be achieved through coding each information flow in instructional design plans. It can be computed by Formula (6) (Zheng, 2017). In Formula (6), Ai denotes the activation quantity of each piece of knowledge. N denotes the number of nodes in the knowledge graph. Taking the STEM instructional design plan of “designing a Mars base” as an example, the activation quantity of the knowledge graph was 319.01, which is equal to the sum of the activation quantity of each node. Figure 2 shows the knowledge graph and the number besides each node denotes the activation quantity.

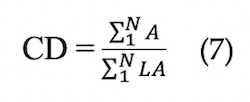
The contribution degree of learners (CD) refers to the ratio of the activation quantity of learners to the total activation quantity. The contribution degree represents the extent to which learners participate in instruction. It can be calculated by Formula (7), in which A denotes the activation quantity of one target knowledge item that is activated by learners, LA denotes the total activation quantity, and N denotes the number of nodes in the target knowledge graph. Taking the STEM instructional design plan of “designing a Mars base” as an example, ∑_1^NN/1A = 121.22, ∑_1^NN/1LA = 319.01, and CD = 0.38.
The integration degree of STEM (ID) represents the extent to which the STEM instructional design plan integrates science, technology, engineering, and mathematics. This indicator aims to measure to what extent a STEM instructional design plan can integrate the learning domains of science, technology, engineering, and mathematics. It is equal to the ratio of the number of tasks containing science, technology, engineering, and mathematics to the number of all tasks. For example, designing and constructing a Mars base with your group members is one of the tasks containing all four STEM areas. In this task, learners need to apply knowledge about science to understand the characteristics of the eight planets, apply technical knowledge to know about the latest detection techniques, apply engineering knowledge to construct a Mars base, and apply mathematics knowledge to compute and make models. Furthermore, Daher (2020) revealed that high quality STEM education should include activities containing science, technology, engineering, and mathematics. This can be computed using Formula (8), in which Q_i denotes the number of tasks that cover the four dimensions of science, technology, engineering, and mathematics in the STEM instructional design plan. Q denotes the total number of tasks in the STEM instructional design plan. Taking the STEM instructional design plan of “designing a Mars base” as an example: Q_i = 2, Q = 9, ID = 0.22.

Two research assistants analysed 20 STEM instructional design plans for two rounds. The interrater reliability calculated using the Kappa value was 0.817, implying high consistency. In addition, the examination of the validity was conducted by designing STEM instructional design plans for the second round. This is similar to using the retest method to examine the content validity of a test. The STEM instructional design plans from the second round can be optimised further based on the assessment results of the first round. It is supposed that the STEM instructional design plans of the second round were better than those of the first round. Thus, the proposed assessment method will be reliable and valid if it can be used to identify the differences and improvements between the first and second rounds.
All procedures in the present study involving human participants were based on the ethical standards of the institutional research committee. The authors declare that they had no funding for this study. The entire study was done on a voluntary basis. No conflict of interest was declared by the authors. Signed consent forms were obtained from all participants.
The proposed assessment method was adopted to evaluate the 20 STEM instructional design plans of the two rounds. Table 2 shows the assessment results of 10 STEM instructional design plans from the first round. The findings revealed that the average values of eight assessment indicators were low and could be improved.
Table 2: Assessment Results of 10 STEM Instructional Designs for the First Round
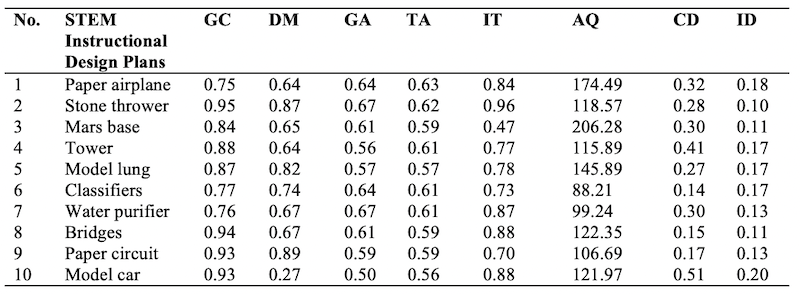
After analysis of the 10 STEM instructional design plans from the first round, the weaknesses of the STEM instructional design plans were clearly identified. The major problems were that the eight assessment indicators were low and needed to be refined accordingly. All STEM instructional design plans were optimised further to form the new instructional design plans for the second round. The same assessment method was used to analyse and evaluate all instructional design plans of the second round. The eight assessment indicators were calculated again. Table 3 shows the assessment results of 10 STEM instructional design plans from the second round. The findings revealed that the average values of the eight assessment indicators of the second round improved compared with the first round.
Table 3: Assessment Results of 10 STEM Instructional Designs for the Second Round
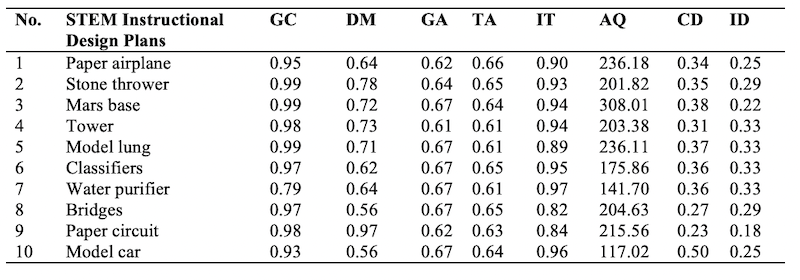
To examine the differences in the STEM instructional design plan between the first and the second round, an interdependent t test was used to analyse the data. Table 4 shows the results. In terms of the alignment between instructional objectives and task design, there was a significant difference between the first and second rounds (t = 3.977, p = 0.003). In addition, there were significant differences in the adaptability of instructional objectives (t = 2.407, p = 0.039), the adaptability of tasks (t = 4.772, p = 0.001), the completeness of information types (t = 2.702, p = 0.024), the activation quantity of the knowledge graph (t = 6.975, p < 0.001), the contribution degree of learners (t = 2.337, p = 0.044), and the integration degree of STEM (t = 7.235, p < 0.001) between the first and second rounds. However, there were still no significant differences in the diversity of instructional media (t = 0.171, p = 0.868) between the first and second rounds. Overall, the proposed assessment method can be used to identify the differences and improvements between the first and second rounds. Therefore, the assessment method of STEM instructional design plans based on the information flows approach was feasible and useful for instructional designers.
Table 4: The Differences between the First and the Second Round
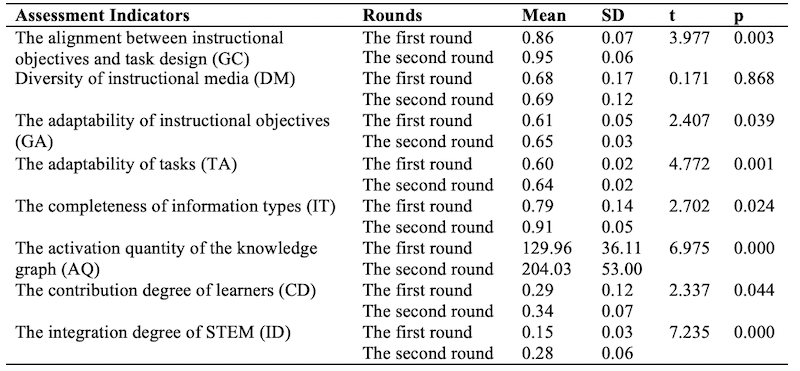
The present study found that, in the second round, the alignment between instructional objectives and task design, adaptability of instructional objectives, adaptability of tasks, completeness of information types, activation quantity of the knowledge graph, contribution degree of learners, and integration degree of STEM were significantly higher than in the first round. Therefore, the overall quality of STEM instructional design plans in the second round was significantly better than that in the first round.
Reflection on and optimisation of instruction design is important to help teachers improve their professional competence and the quality of their teaching (Özdemir, 2020). To identify the issues of STEM instructional design plans and enhance the quality of STEM instructional design, in-depth reflection on the first-round STEM instructional design plans across different indicators was carried out.
First, regarding the alignment between instructional objectives and task design, it was found that the alignment of the three STEM instructional design plans of the first round was very low. The main reason was that the task design did not match the instructional objectives. The designed tasks of the first round were also very simple and could not achieve the expected instructional objectives. After revision, the alignment between instructional objectives and task design improved in the STEM instructional design plans of the second round.
Second, multiple kinds of instructional media had been adopted for most STEM instructional design plans in the first round. Therefore, the diversity of instructional media in the second round did not improve substantially, and the difference in the diversity of instructional media was not significant after optimisation.
Third, with respect to the adaptability of instructional objectives, the results revealed that some STEM instructional design plans of the first round only designed instructional objectives at one difficulty level. This was not appropriate and would not be adapted for all learners. After revision, the adaptability of instructional objectives improved in the STEM instructional design plans of the second round.
Fourth, in terms of task adaptability, the findings indicated that several STEM instructional design plans in the first round designed tasks only at one level. This was not appropriate and would not be adaptive for all learners. Therefore, learning tasks with different adaptability levels were added in the second-round design plans to adapt to different levels of learners. Thus, the task adaptability was improved in the STEM instructional design plans of the second round.
Fifth, in terms of the completeness of information types, it was found that some STEM instructional design plans in the first round designed only one type of information. Thus, multiple information types were increased in the second round of design plans to engage learners in STEM activity. Hence, the completeness of information types improved in the STEM instructional design plans of the second round.
Sixth, concerning the quantity of activation of the knowledge graph, some STEM instructional design plans in the first round activated only part of the target knowledge. The instructional plan of the first round was not well designed and was very simple. After optimisation, the quantity of activation of the knowledge graph improved in the STEM instructional design plans of the second round.
Seventh, regarding the contribution degree of learners, it was found that there was a lack of interactions and participation in some STEM instructional design plans in the first round. Sometimes, instructional designers expected students to answer a question, but none of them were able to do so. Accordingly, the second round of instructional design plans increased students’ interactions with peers and teachers to improve the contribution degree of learners. For example, students answered teachers’ questions and discussed them with peers. Therefore, the contribution degree of learners increased in the STEM instructional design plans of the second round. As Yang et al. (2023) revealed, the learners’ contribution degree was related to the instructional quality.
Finally, regarding the degree of integration of STEM, the average integration degree of all STEM instructional design plans in the first round was very low. The main reason was that many tasks were not comprehensive and focused on only one discipline. After revision, the degree of integration of STEM improved in the instructional design plans of the second round. As Aydin Gunbatar et al. (2022) indicated, the integration degree of STEM was related to the quality of STEM instructional design plans.
The present study has implications for instructors, practitioners, and researchers. This study proposed an innovative method to quantitatively assess STEM instructional design plans. This quantitative method involved analysing information flows, calculating eight assessment indicators, and could be adopted to assess the quality of STEM instructional design plans. Furthermore, this study revealed that STEM instructional design plans could be optimised iteratively. Each STEM instructional design plan could be continually refined based on the eight indicators. As Kim (2021) indicated, instructional design plans can be better when they are modified and refined iteratively.
In addition, the information flow approach was useful and powerful for analysing and assessing STEM instructional design plans. The information flow approach focuses on information flows of instruction systems (Yang & Zhang, 2009). The target knowledge graph is the main reference when analysing instructional design plans. The proposed method maps information flows of STEM instructional design plans onto the target knowledge graph, which can reduce subjectivity to a large extent. Hence, it is suggested that the information flow approach could be used when assessing STEM instructional design plans.
It is recommended that teachers use this method to evaluate their STEM instructional design plans. Three steps are involved when one is using the proposed assessment method. The first step is to draw a target knowledge graph. The second step is to segment and code the information flows of STEM instructional design plans using the developed tool. The third step is to calculate eight indicators and reflect the deficiency of instructional design plans. The instructional design plans were targeted for improving teaching and learning to achieve the best results. Therefore, teachers could revise and optimise their instructional design plans further to form optimal plans for implementation.
This study has several limitations. First, there was only a small number of STEM instructional design plans. In total, 20 STEM instructional design plans were designed and analysed. Further research should expand the number of STEM instructional design plans to validate the assessment method. Second, the analysis of STEM instructional design plans was time-consuming. To design instructional plans more effectively and efficiently, further studies should develop a tool to automatically analyse STEM instructional design plans and calculate assessment indicators. Third, only pre-service teachers were invited to participate in this study. Further studies should invite experienced teachers to design instructional design plans. In addition, the effectiveness of the proposed method for learners should be examined further.
The main objective of the present study was to propose an innovative method to assess STEM instructional design plans based on information flows. The innovation of the proposed assessment method lies in two aspects. First, the instruction system was considered as a complex information system. The information flows within the instruction system were regarded as the research object. In the proposed assessment method, an instructional design plan was considered a complex information system. Second, the proposed assessment method analysed STEM instructional design plans through the information flows approach, which focused on information flows of STEM instructional design plans. This was rarely done in previous studies. The information flows approach was relatively objective since the target knowledge graph was regarded as the reference of coding and segmenting information flows of the instruction design plans. The target knowledge graph was drawn based on the instructional objectives. Usually, instructional objectives were identical for the same course. Therefore, different teachers could draw the same target knowledge graph.
This assessment method was validated by analysing 20 STEM instructional design plans. The results indicated that the assessment method was feasible and effective for assessing STEM instructional design plans. In addition, STEM instructional design plans could be continually optimised by evaluating the eight assessment indicators. This study provided insight into how to design and optimise STEM instructional design plans. The current study also elucidated ways to improve STEM instruction design plan quality using the proposed assessment method.
Acknowledgement: This study was supported by the National Key Research and Development program of China (2023YFC3341200).
Aldemir, J., & Kermani, H. (2017). Integrated STEM curriculum: Improving educational outcomes for Head Start children. Early Child Development and Care, 187(11), 1694-1706. https://doi.org/10.1080/03004430.2016.1185102
Aydin Gunbatar, S., Oztay, E.S., & Ekiz Kiran, B. (2022). Supporting pre-service teachers’ integration of engineering into STEM lessons throughout engineering-infused training. Research in Science & Technological Education, 1-21. https://doi.org/10.1080/02635143.2022.2121691
Aykan, A., & Yıldırım, B. (2022). The integration of a lesson study model into distance STEM education during the Covid-19 pandemic: Teachers’ views and practice. Technology, Knowledge and Learning, 27(2), 609-637. https://doi.org/10.1007/s10758-021-09564-9
Daher, W., & Shahbari, J.A. (2020). Design of STEM activities: Experiences and perceptions of prospective secondary school teachers. International Journal of Emerging Technologies in Learning (iJET), 15(4), 112-128. https://www.learntechlib.org/p/217233
Denscombe, M. (2010), The good research guide: For small-scale social research projects (4th ed.). Open University Press.
Han, S., Yalvac, B., Capraro, M. M., & Capraro, R. M. (2015). In-service teachers’ implementation and understanding of STEM project based learning. Eurasia Journal of Mathematics, Science and Technology Education, 11(1), 63-76. https://doi.org/10.12973/eurasia.2015.1306a
He, W.T., Zhou, Y.L., Li, M.H., Zhu, L.L., Li, F.M. (2020). Construction of evaluation index system for teaching system quality under DCR paradigm. Research on Electrochemical Education, 3, 48-55. https://doi.org/0.13811/j.cnki.eer.2020.03.006.
Kim, M.S. (2021). A systematic review of the design work of STEM teachers. Research in Science & Technological Education, 39(2), 131-155. https://doi.org/10.1080/02635143.2019.1682988
Mohajan, H.K. (2018). Qualitative research methodology in social sciences and related subjects. Journal of Economic Development, Environment and People, 7(1), 23-48. https://mpra.ub.uni-muenchen.de/85654/
Özdemir, N. (2020). How to improve teachers’ instructional practices: The role of professional learning activities, classroom observation and leadership content knowledge in Turkey. Journal of Educational Administration, 58(6), 585-603. https://doi.org/10.1108/JEA-10-2019-0189
Pellas, N., Dengel, A., & Christopoulos, A. (2020). A scoping review of immersive virtual reality in STEM education. IEEE Transactions on Learning Technologies, 13(4), 748-761. https://doi.org/10.1109/TLT.2020.3019405
Reigeluth, C.M. (2013). What is instructional-design theory and how is it changing?. In C.M. Reigeluth (Ed.), Instructional-design theories and models (pp. 5-29). Routledge.
Reiser, R.A. (2001). A history of instructional design and technology: Part II: A history of instructional design. Educational Technology Research and Development, 49(2), 57-67. https://doi.org/10.1007/BF02504928
Sánchez Carracedo, F., Soler, A., Martín, C., López, D., Ageno, A., Cabré, J., ... & Gibert, K. (2018). Competency maps: An effective model to integrate professional competencies across a STEM curriculum. Journal of Science Education and Technology, 27, 448-468. https://doi.org/10.1007/s10956-018-9735-3
Schilderman, H. (2011). Quantitative method. The Wiley Blackwell companion to practical theology, 123-132. https://doi.org/10.1002/9781444345742.ch11
Shannon, C.E. (1948). A mathematical theory of communication. The Bell System Technical Journal, 27(3), 379-423. https://doi.org/10.1002/j.1538-7305.1948.tb01338.x
Suzan, M.H., Samrin, N.A., Biswas, A.A., & Pramanik, A. (2021). Students' adaptability level prediction in online education using machine learning approaches. In 2021 12th International Conference on Computing Communication and Networking Technologies (ICCCNT) (pp. 1–7). IEEE. https://doi.org/10.1109/ICCCNT51525.2021.9579741
Wilson, H.E. (2018). Integrating the arts and STEM for gifted learners. Roeper Review, 40(2), 108-120. https://doi.org/10.1080/02783193.2018.1434712
Yang, K. Ch. (2007). Preliminary study on the analysis technology of the instruction system. Journal of China Educational Technology, 8, 1-5. https://next.cnki.net/middle/abstract?v=rbgYNE3Bhz9XWg1m9GildBS6B-5s9KTUaYPtfGA84FaEJNYDXIC-UUrFlEp80Zjjvcy5xUuRQHSG3VYE_qc-ztBgYayI55A0oL7iTSKgekbyoxi7spY_z5EXP8V5bXakTvNn1RD9q6zht8zFQkVVCJAOgn2OKmeDwPbYOBENT0kQe0ToOuiyTA==&uniplatform=NZKPT&language=CHS&scence=null
Yang, K. Ch., & Zhang, X.Y. (2009). Education technology: A special understand mode of education. Journal of China Educational Technology, 10, 7–11. https://kns.cnki.net/kcms2/article/abstract?v=rbgYNE3Bhz8mSkkgv2ypIEgfKcho4MjXqbq7jL-g_pe0jxQHCioqFI2v-Jk13DPldn5j38yrpLFxpHGkr-wNmVTr7_r1eFGNVbQNztEu0RVI0fRr4bvPnEoybRgilPsGl9OHi4UHAelIlUmjze0koHjVvfrILYsCEoUJ7kOWuSI=&uniplatform=NZKPT&language=CHS&rp=NZKPT
Yang, K. Ch., & Zhang, Y.Y. (2015). The construction of a teaching plan quality assessment index system based on IIS graph analysis. E-learning in China, 1, 124-130. https://next.cnki.net/middle/abstract?v=rbgYNE3Bhz_w2H6LVwrbBguoG-vJRG1SfW7BTfpbl_1DgR2wVypkWcPVsrckuX0Hp5fPflN3mXn2n1HpY_8v5V898iYjvDmhYj1Y8m7SKTaZ9JHTaiO06DhnUqxXg4hnaZF7gg6UcEecBC5qnI0YqQFN-PdwRi34Yam0dP-eRNASd2n9nYfTmQ==&uniplatform=NZKPT&language=CHS&scence=null
Yang, G., Shen, Q., & Jiang, R. (2023). Exploring the relationship between university students’ perceived English instructional quality and learner satisfaction in the online environment. System, 119, 103178. https://doi.org/10.1016/j.system.2023.103178
Zheng, L., Huang, Z., & Liu, Y. (2021). Data-driven design for computer-supported collaborative learning-design matters. Springer.
Zheng, L. (2017). Knowledge building and regulation in computer supported collaborative learning. Springer.
Author Notes
Lanqin Zheng works at the Faculty of Education in Beijing Normal University. Her research interests include computer supported collaborative learning, learning analytics, AIED, and STEM. Email: bnuzhenglq@bnu.edu.cn (https://orcid.org/0000-0001-9378-5027)
Zichen Huang is a master’s student at the Faculty of Education in Beijing Normal University and whose research interests include STEM and educational technology. Email: 202221010183@mail.bnu.edu.cn (No Orcid Number)
Yang Liu is a master’s student at the Faculty of Education in Beijing Normal University and whose research interests include STEM and educational technology. Email: 201922010193@mail.bnu.edu.cn (No Orcid Number)
Cite as: Zheng, L., Huang, Z., & Liu, Y. (2024). Study on the assessment of STEM instructional design plans based on information flows Journal of Learning for Development, 11(3), 414-429.